Networks viewer
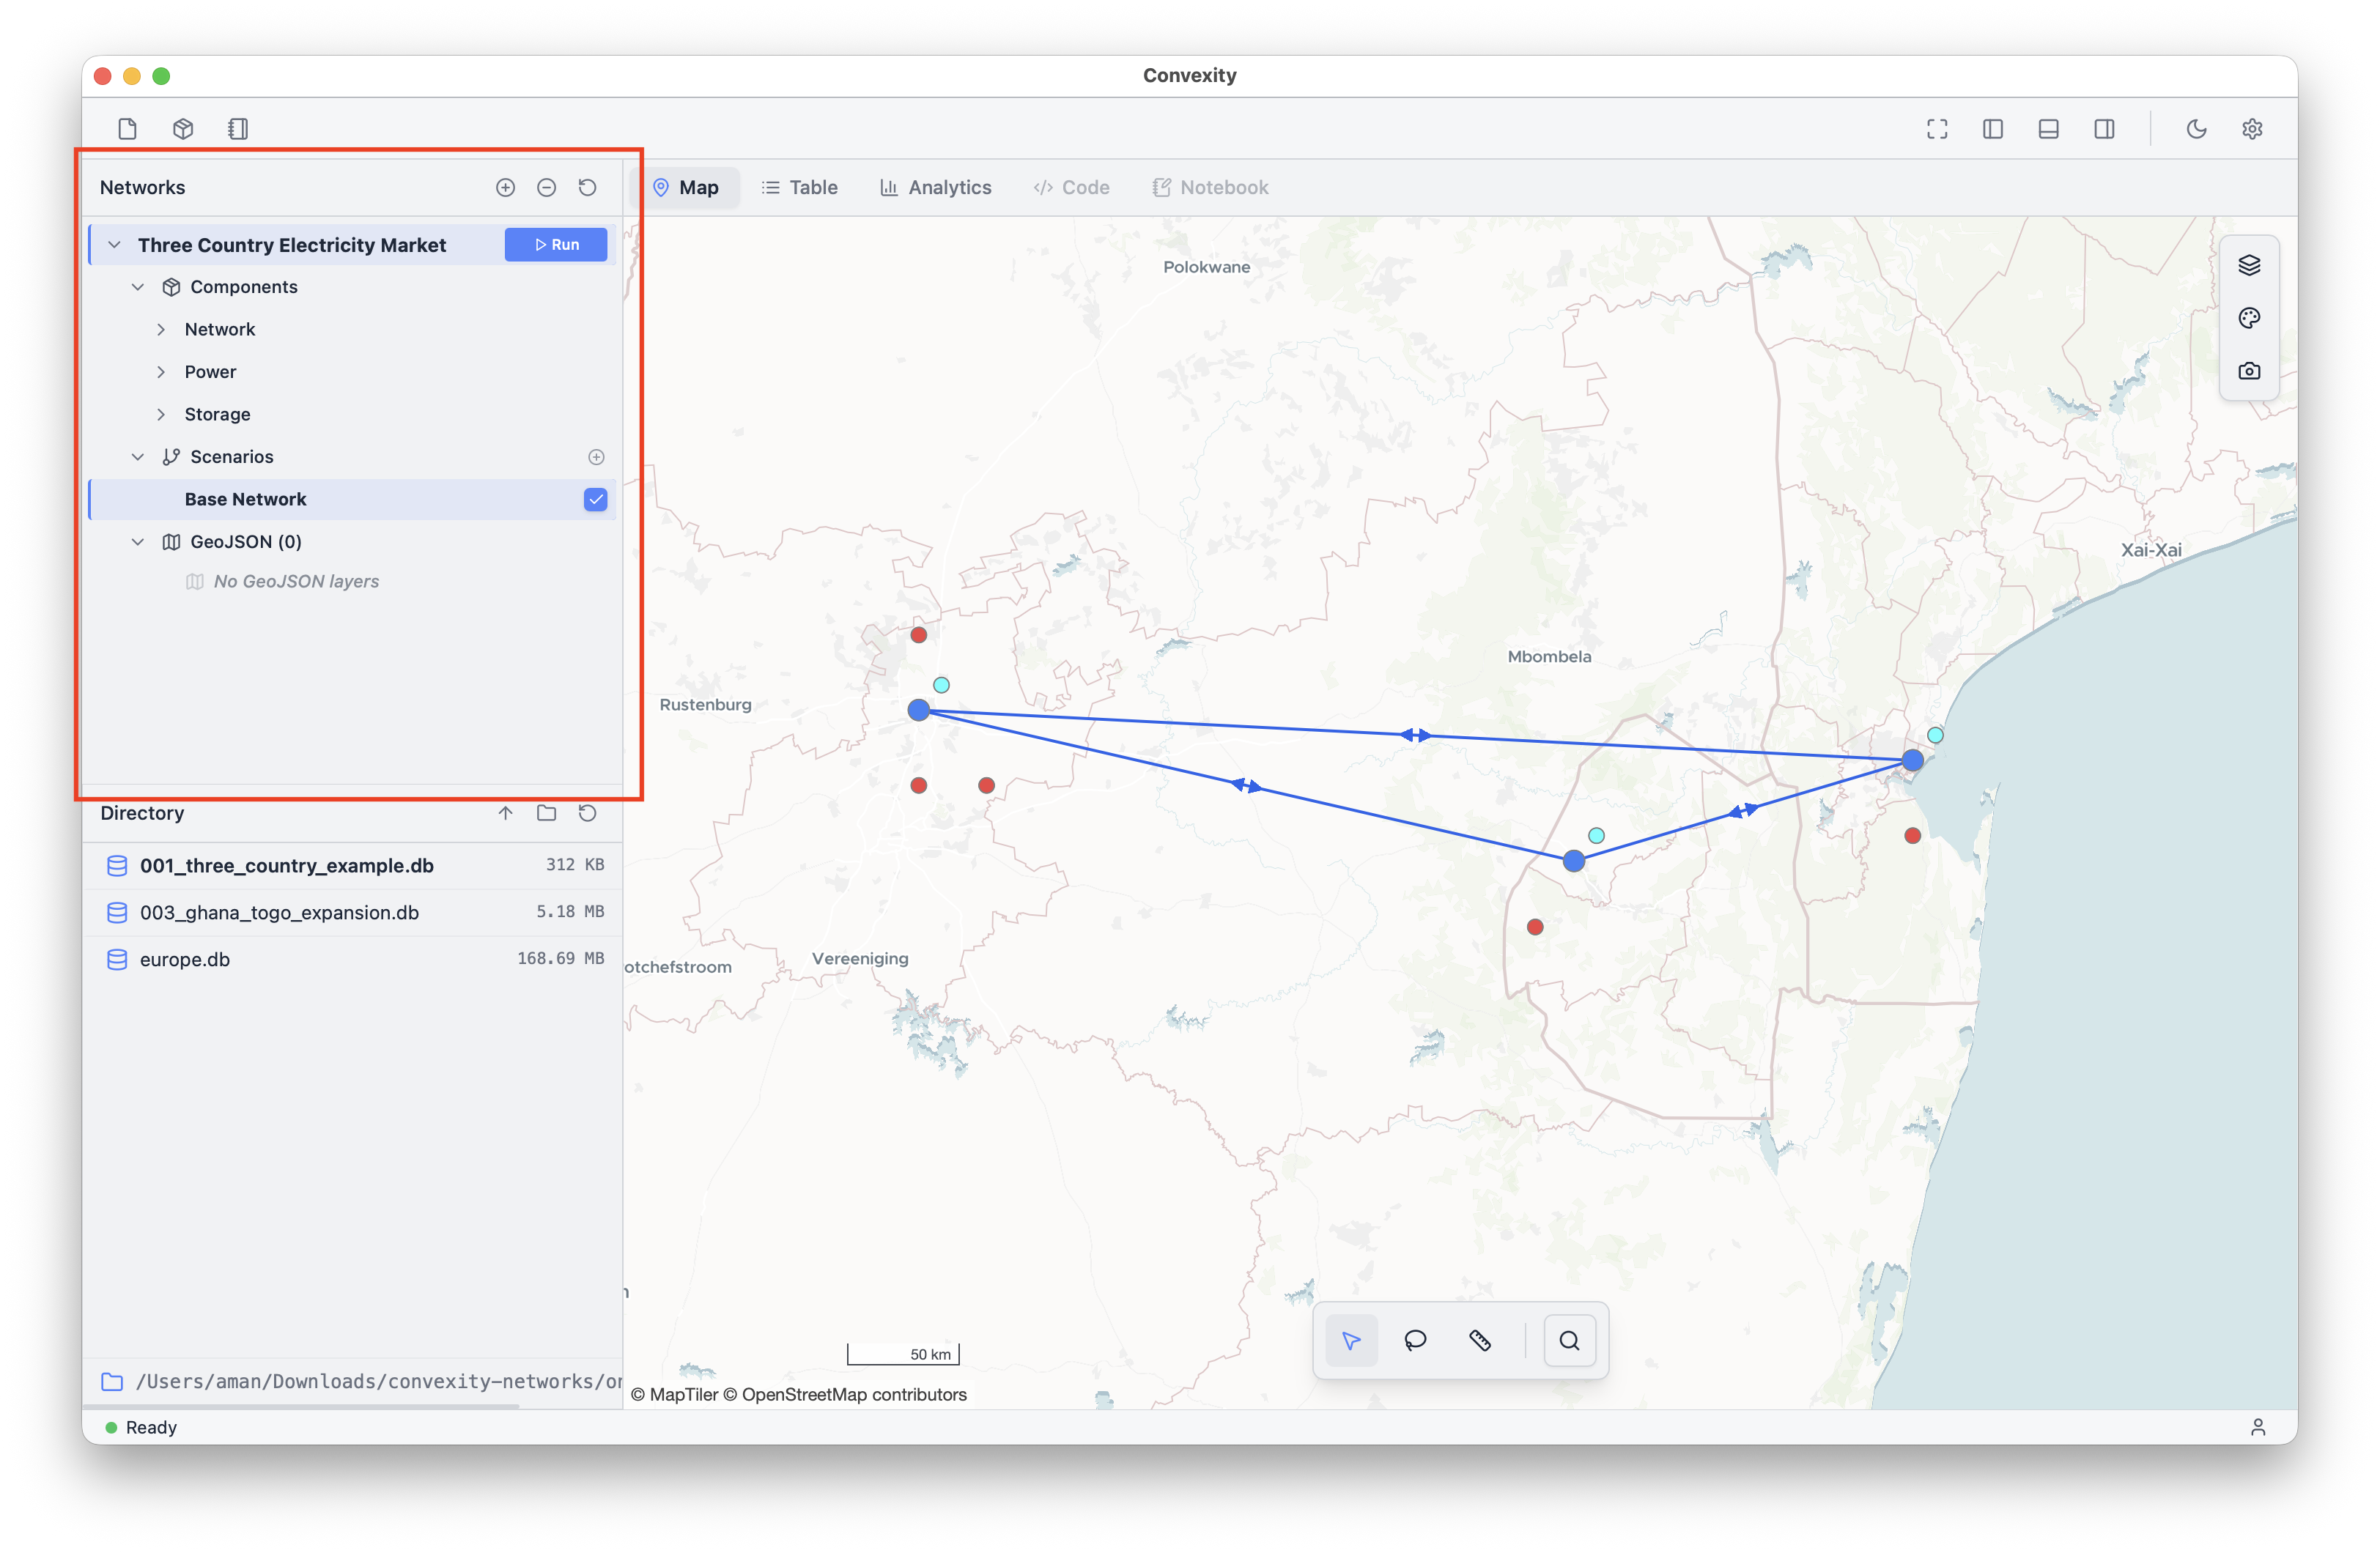
The Networks Viewer in the top-left of the screen shows the networks currently open in the app. Networks are opened by right-clicking on their .db files in the Directory Browser in the bottom left and selecting "Load". A network must be listed here to be viewed, edited, and solved in the rest of the app.
The Networks Viewer shows a top-level for each network which can be expanded to show a list of its components and scenarios. The "Run" button launches a solve process for that network.
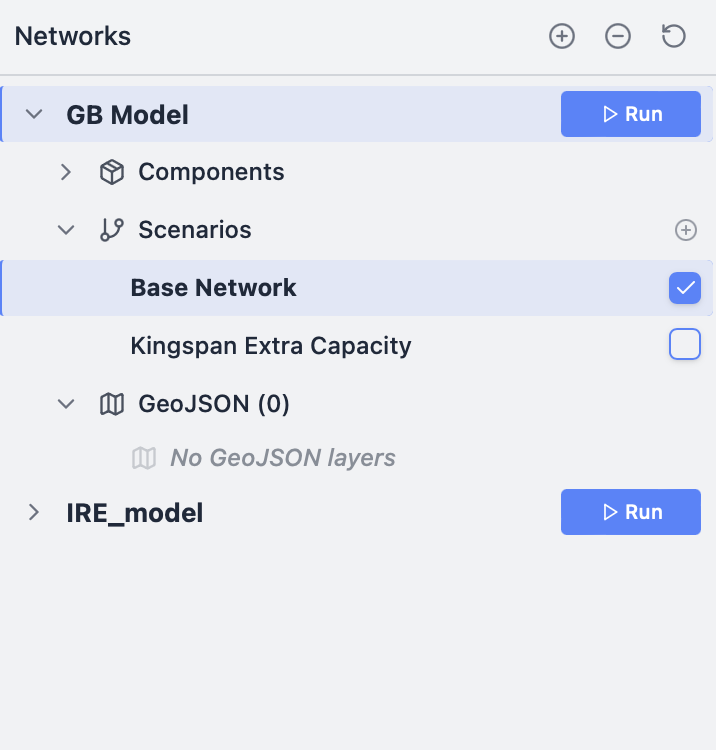
The blue shading behind the network name shows which network is currently selected (appearing in the map, table, etc.). The blue shading behind the scenario name shows which scenario is currently selected (determining which scenario-specific values are shown in the rest of the app).
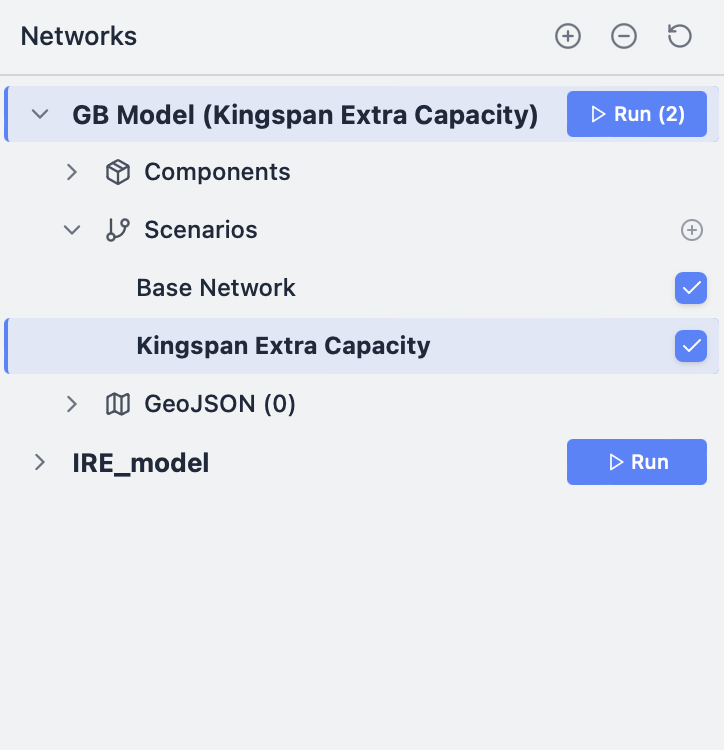
In this image, a different scenario is selected to view (blue shading). Both scenarios have their checkboxes ticked, so the "Run" button displays "(2)" as it will launch solve processes for both scenarios when clicked.
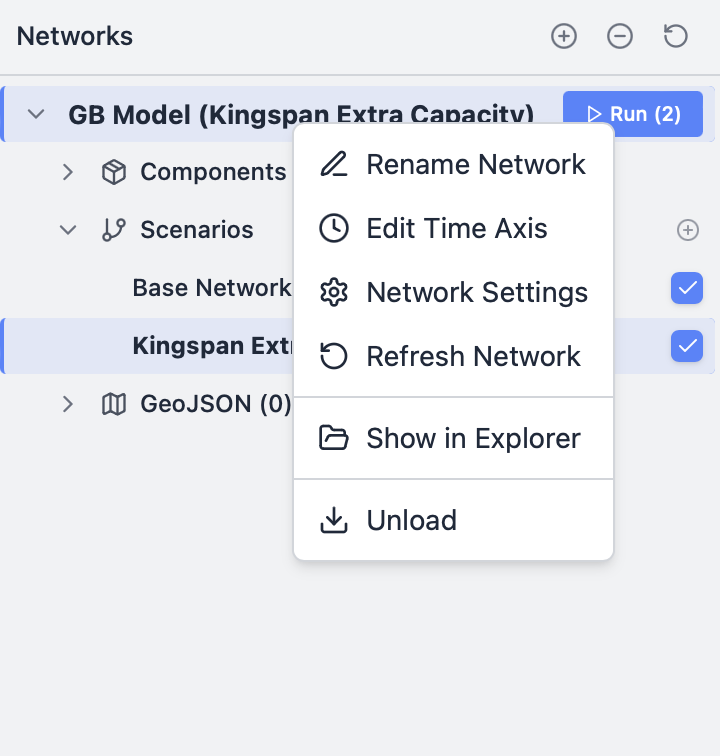
Right-clicking a network name in the tree opens a dropdown menu to rename the network, edit its time axis (slice or resample), edit its settings, refresh it in the app, show its file location, or unload from the Network Viewer.