Layers Controls
The Layers control panel allows you to customize what's displayed on the map, giving you control over basemaps, network components, and overlay data. This helps you focus on the information that's most relevant to your current task.
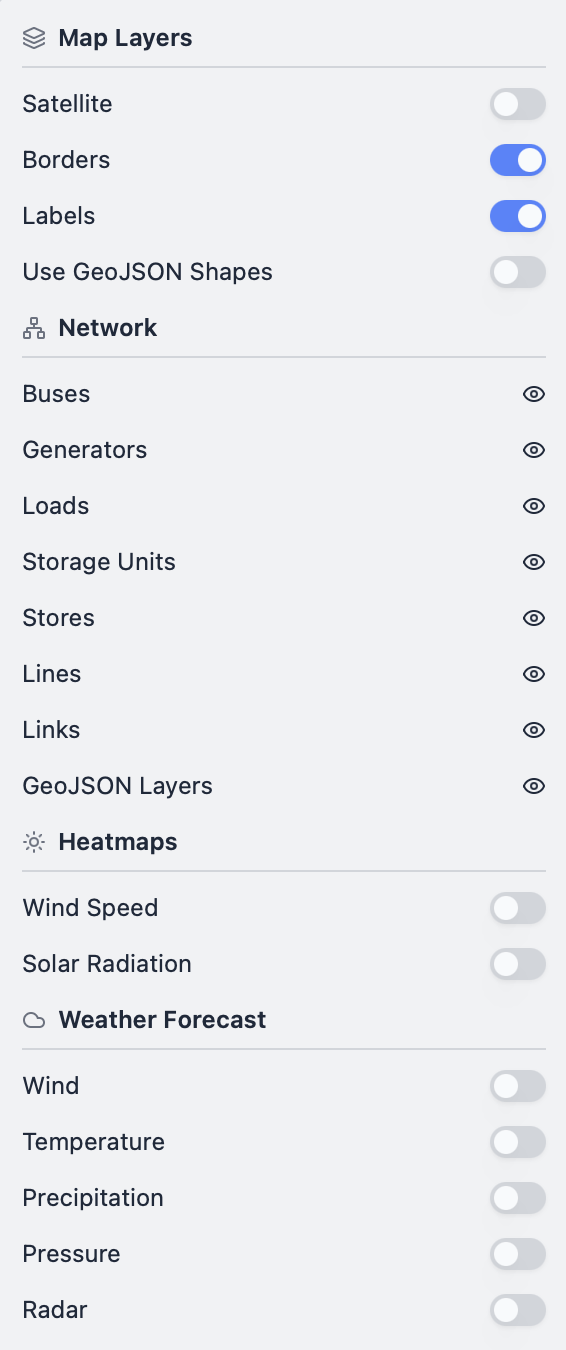
Map Layers
These controls affect the base map and geographic features displayed underneath your network data.
Satellite
Toggle satellite imagery on or off. When enabled, the map displays high-resolution satellite imagery as the basemap, which can help you visualise the actual terrain, infrastructure, and geographic context of your energy system. When disabled, the map uses a standard cartographic basemap.
Borders
Toggle country and administrative borders on or off. This can help you understand the geographic and political context of your network. Note: Convexity displays borders for reference purposes only and does not take any view on geographical boundaries or territorial disputes.
Labels
Toggle geographic labels (city names, place names, etc.) on or off. Labels can be helpful for orientation but may sometimes clutter the map when working with dense network data. Note: Convexity displays labels for reference purposes only and does not take any view on geographical boundaries or naming conventions.
Use GeoJSON Shapes
Toggle between simplified and detailed geometries for network components.
When toggled off: The map displays simplified line/node geometries that show the topological structure of your network clearly and efficiently.
When toggled on: The map displays GeoJSON geometries if available for your assets. This can show actual transmission line routes (polylines), service area boundaries (polygons), and other geographic details. GeoJSON shapes provide a more accurate spatial representation but may take longer to render for large networks.
This option is particularly useful when you want to see how your network aligns with real-world infrastructure or geographic features.
Network Components
The Network Components section allows you to control the visibility of different component types on the map. You can show or hide individual component categories such as:
- Bus: Network nodes where components connect
- Generator: Power generation facilities
- Load: Electricity demand points
- Line: AC transmission lines
- Link: DC transmission links or converters
- Storage Unit: Energy storage facilities
- Store: Energy stores
- Unmet Load: Points where demand cannot be met
This feature is invaluable when working with complex networks, as it lets you focus on specific aspects of your system. For example, you might hide all components except Generators and Lines when analyzing transmission pathways, or show only Buses and Loads when examining demand patterns.
Heatmaps
Heatmaps provide visual overlays that can help you understand resource availability and spatial patterns in your network.
Wind Speed
Displays a heatmap overlay showing wind speed data across the map area with data from the Global Wind Atlas. This can be useful for understanding potential wind generation capacity at different locations and for siting wind farms optimally. The heatmap uses colour intensity to represent wind speed values, with warmer colours typically indicating higher wind speeds.
Solar Radiation
Displays a heatmap overlay showing solar irradiance data across the map area with data from the Global Solar Atlas. This visualisation helps you understand solar resource availability, which can be useful for siting solar generation facilities and understanding potential generation capacity. Areas with higher solar radiation appear with greater intensity on the heatmap.
Weather Forecast
The Weather Forecast section provides access to real-time and forecast weather data overlays. These layers can be particularly useful for operational analysis, as weather conditions directly impact renewable generation and demand patterns. All data provided are the free weather layers for MapTiler SDK.
Wind
Displays wind forecast data as an overlay on the map. This can show predicted wind speeds and directions, helping you understand how wind generation might vary over time and across locations.
Temperature
Displays temperature forecast data. Temperature forecasts are valuable for predicting cooling/heating demand and understanding how thermal generation efficiency might be affected by ambient conditions.
Precipitation
Displays precipitation forecast data. This can be useful for understanding hydroelectric generation potential, as well as how weather might affect demand patterns or infrastructure operations.
Pressure
Displays atmospheric pressure forecast data. Pressure data can provide context for other weather patterns and may be relevant for certain types of analysis.
Radar
Displays weather radar imagery showing current precipitation patterns and movement. This real-time data can be particularly valuable for operational decision-making, allowing you to see current weather conditions that might affect your network.