Introduction
Welcome to Convexity, a modern desktop application for energy systems modelling developed by Bayesian Energy. Whether you're running short-term operational simulations or long-term capacity planning studies, Convexity provides the tools you need to model complex energy systems at various spatial and temporal resolutions.
This user guide will help you get familiar with Convexity's interface and features. You'll learn how to navigate the application, work with your network data, and make the most of Convexity's powerful modelling capabilities.
Interface Overview
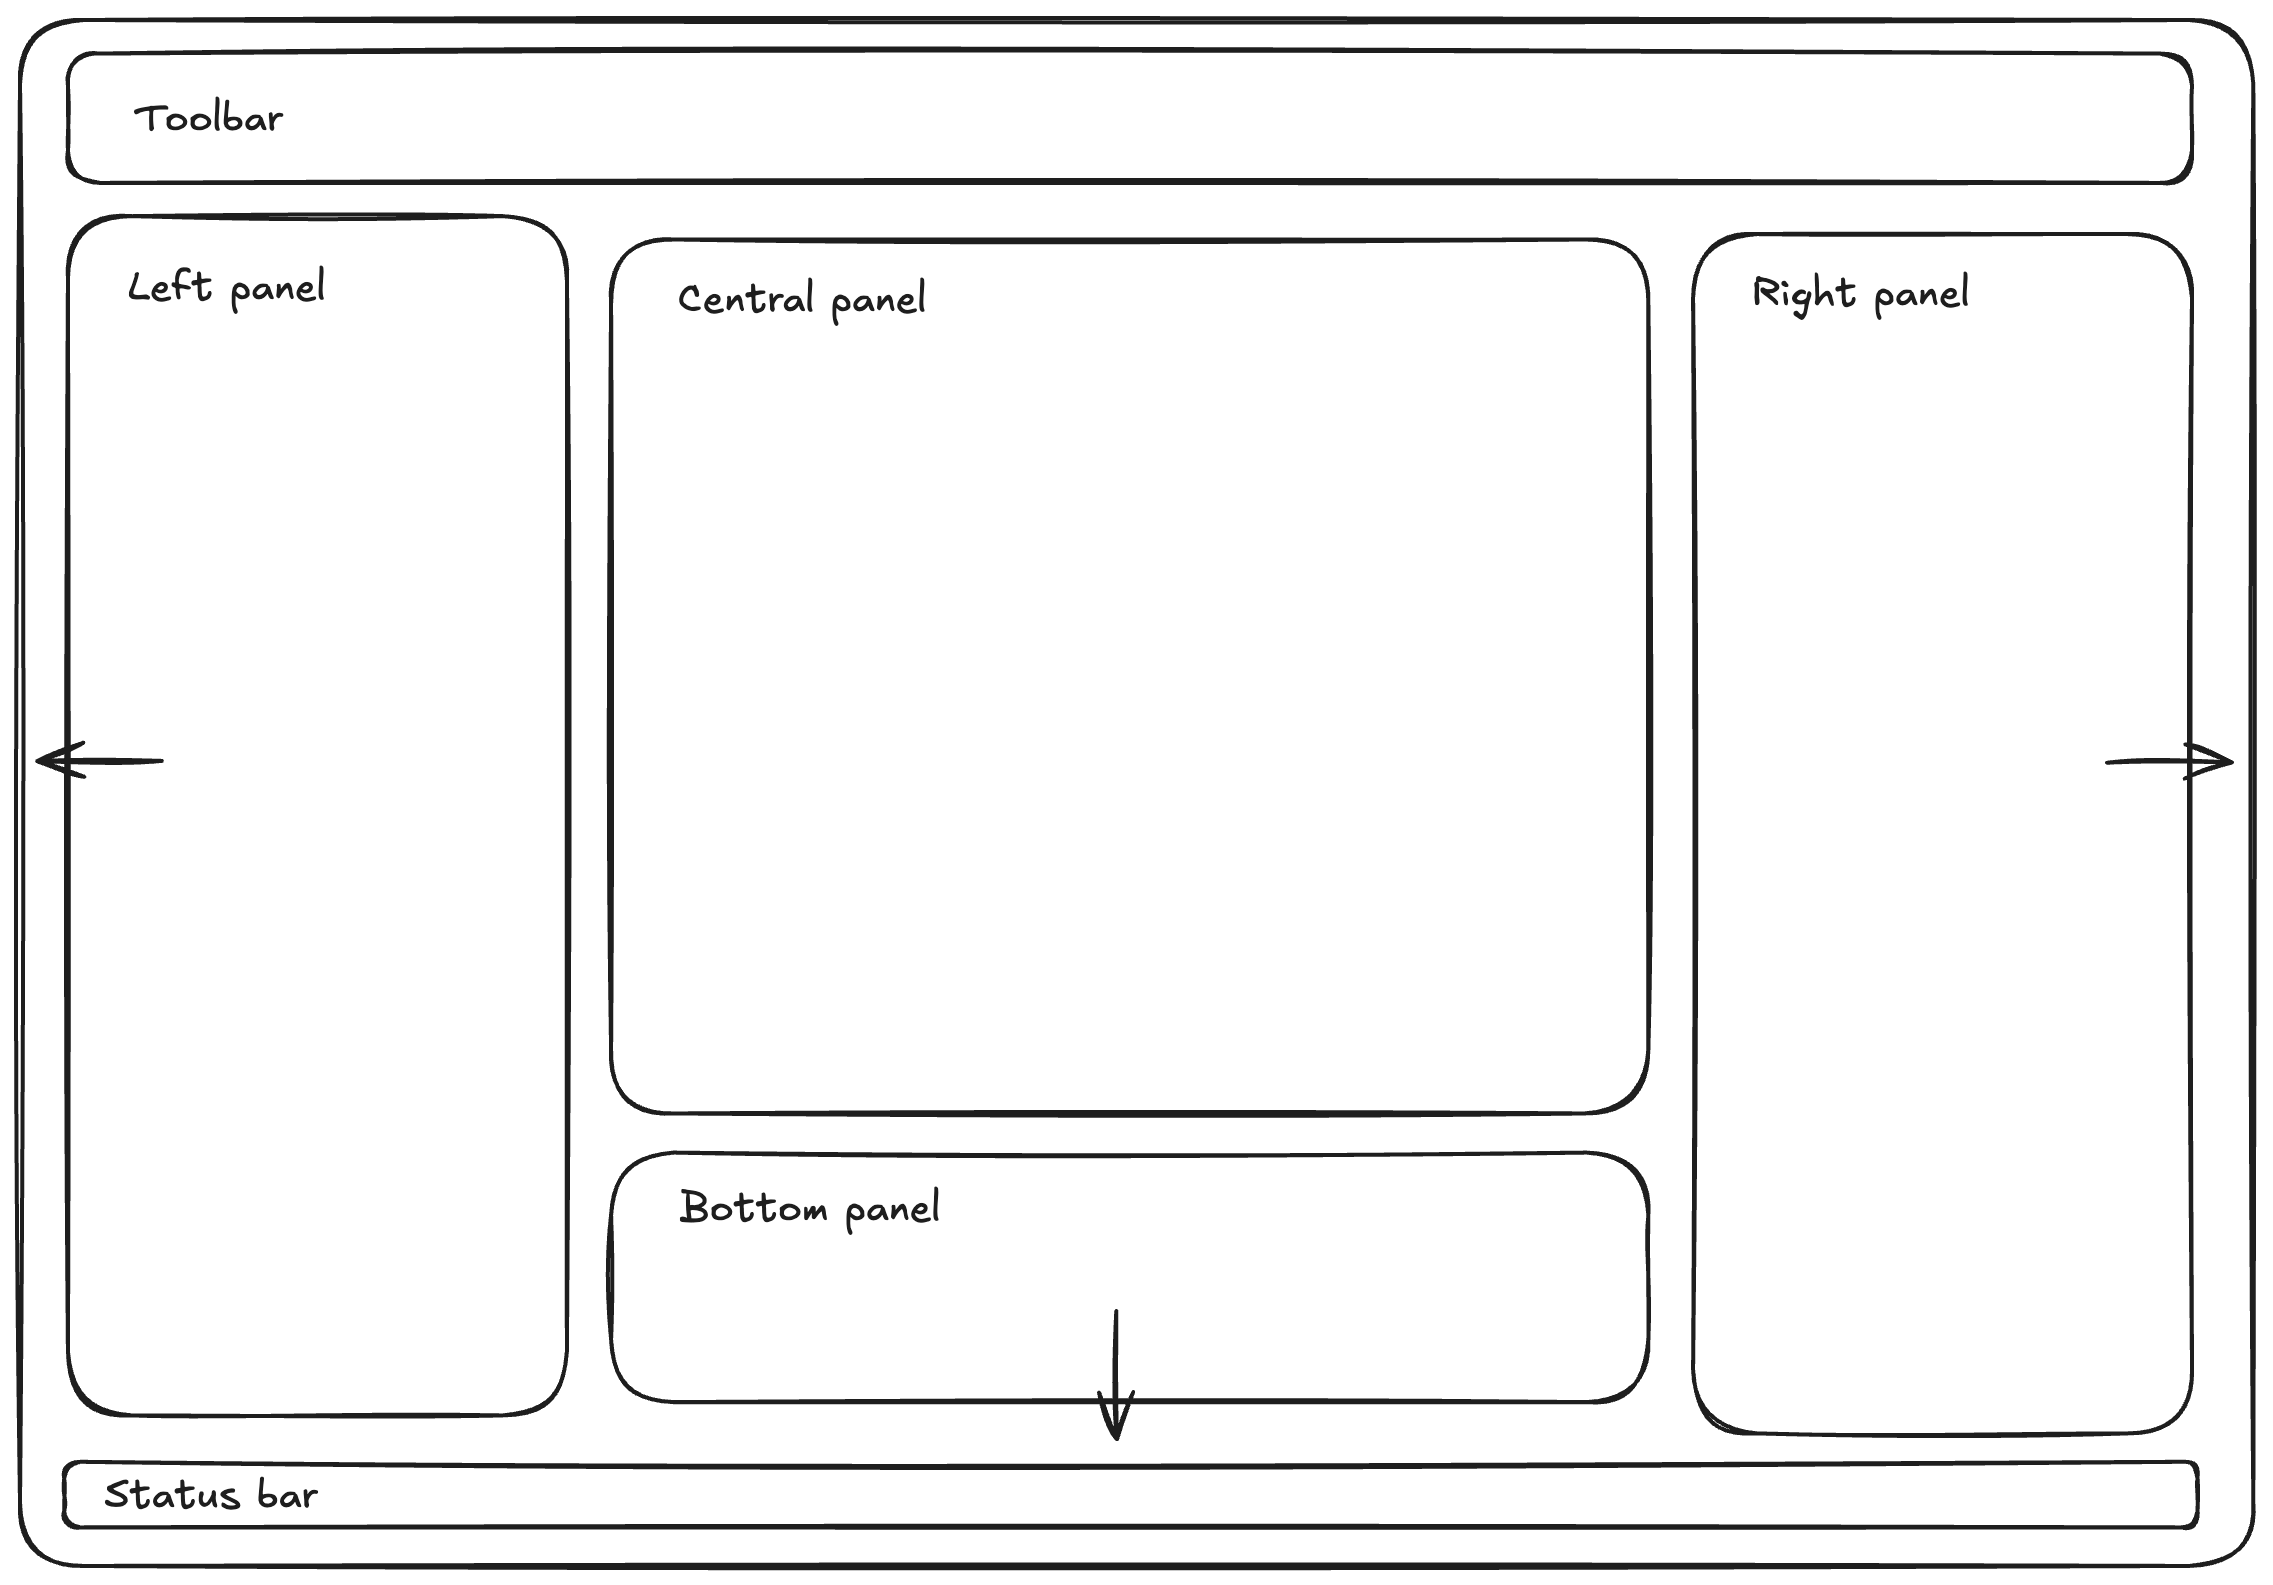
Convexity features a flexible, customizable interface designed with energy system modellers in mind. The application is organised into distinct panels that you can resize, rearrange, or hide based on your workflow:
- Central panel: This is always visible and serves as the main workspace where you'll interact with maps, tables, analytics, and the editor
- Left panel: Contains the Networks Viewer and Directory Viewer for managing your models and files
- Right panel: Houses the Asset Viewer for detailed component editing
- Bottom panel: Provides access to utilities like the Jobs Manager, Terminal, and Logs
All panels except the central one can be hidden or shown using the toolbar controls, allowing you to customise your workspace for maximum productivity.
Familiar Design Principles
Convexity is designed to feel familiar if you've used modern software tools. The interface draws inspiration from:
- GIS software: Spatial visualisation and network topology editing
- Code editors: Tabbed interfaces, terminal integration, and extensibility
- Spreadsheet applications: Tabular data editing and bulk operations
- Data analysis tools: Interactive charts, filters, and customizable dashboards
This design approach means you can leverage skills you've already developed in other tools, reducing the learning curve and helping you be productive quickly. Whether you're comfortable with geographic information systems, prefer working with tables, or love diving into data visualisation, Convexity's interface adapts to your preferred way of working.
What's Next?
The following sections in this guide will walk you through each part of the Convexity interface in detail:
- Toolbar: Learn about file operations, templates, and application settings
- Central Canvas: Explore the Map, Tables, and Analytics views
- Left Panel: Discover how to manage networks and navigate your file system
- Right Panel: Understand how to edit individual components using the Asset Viewer
- Bottom Panel: Use utilities like the Jobs Manager, Terminal, and Logs
Ready to get started? Continue reading to learn how each part of the interface works together to support your energy systems modelling workflow.