Analytics
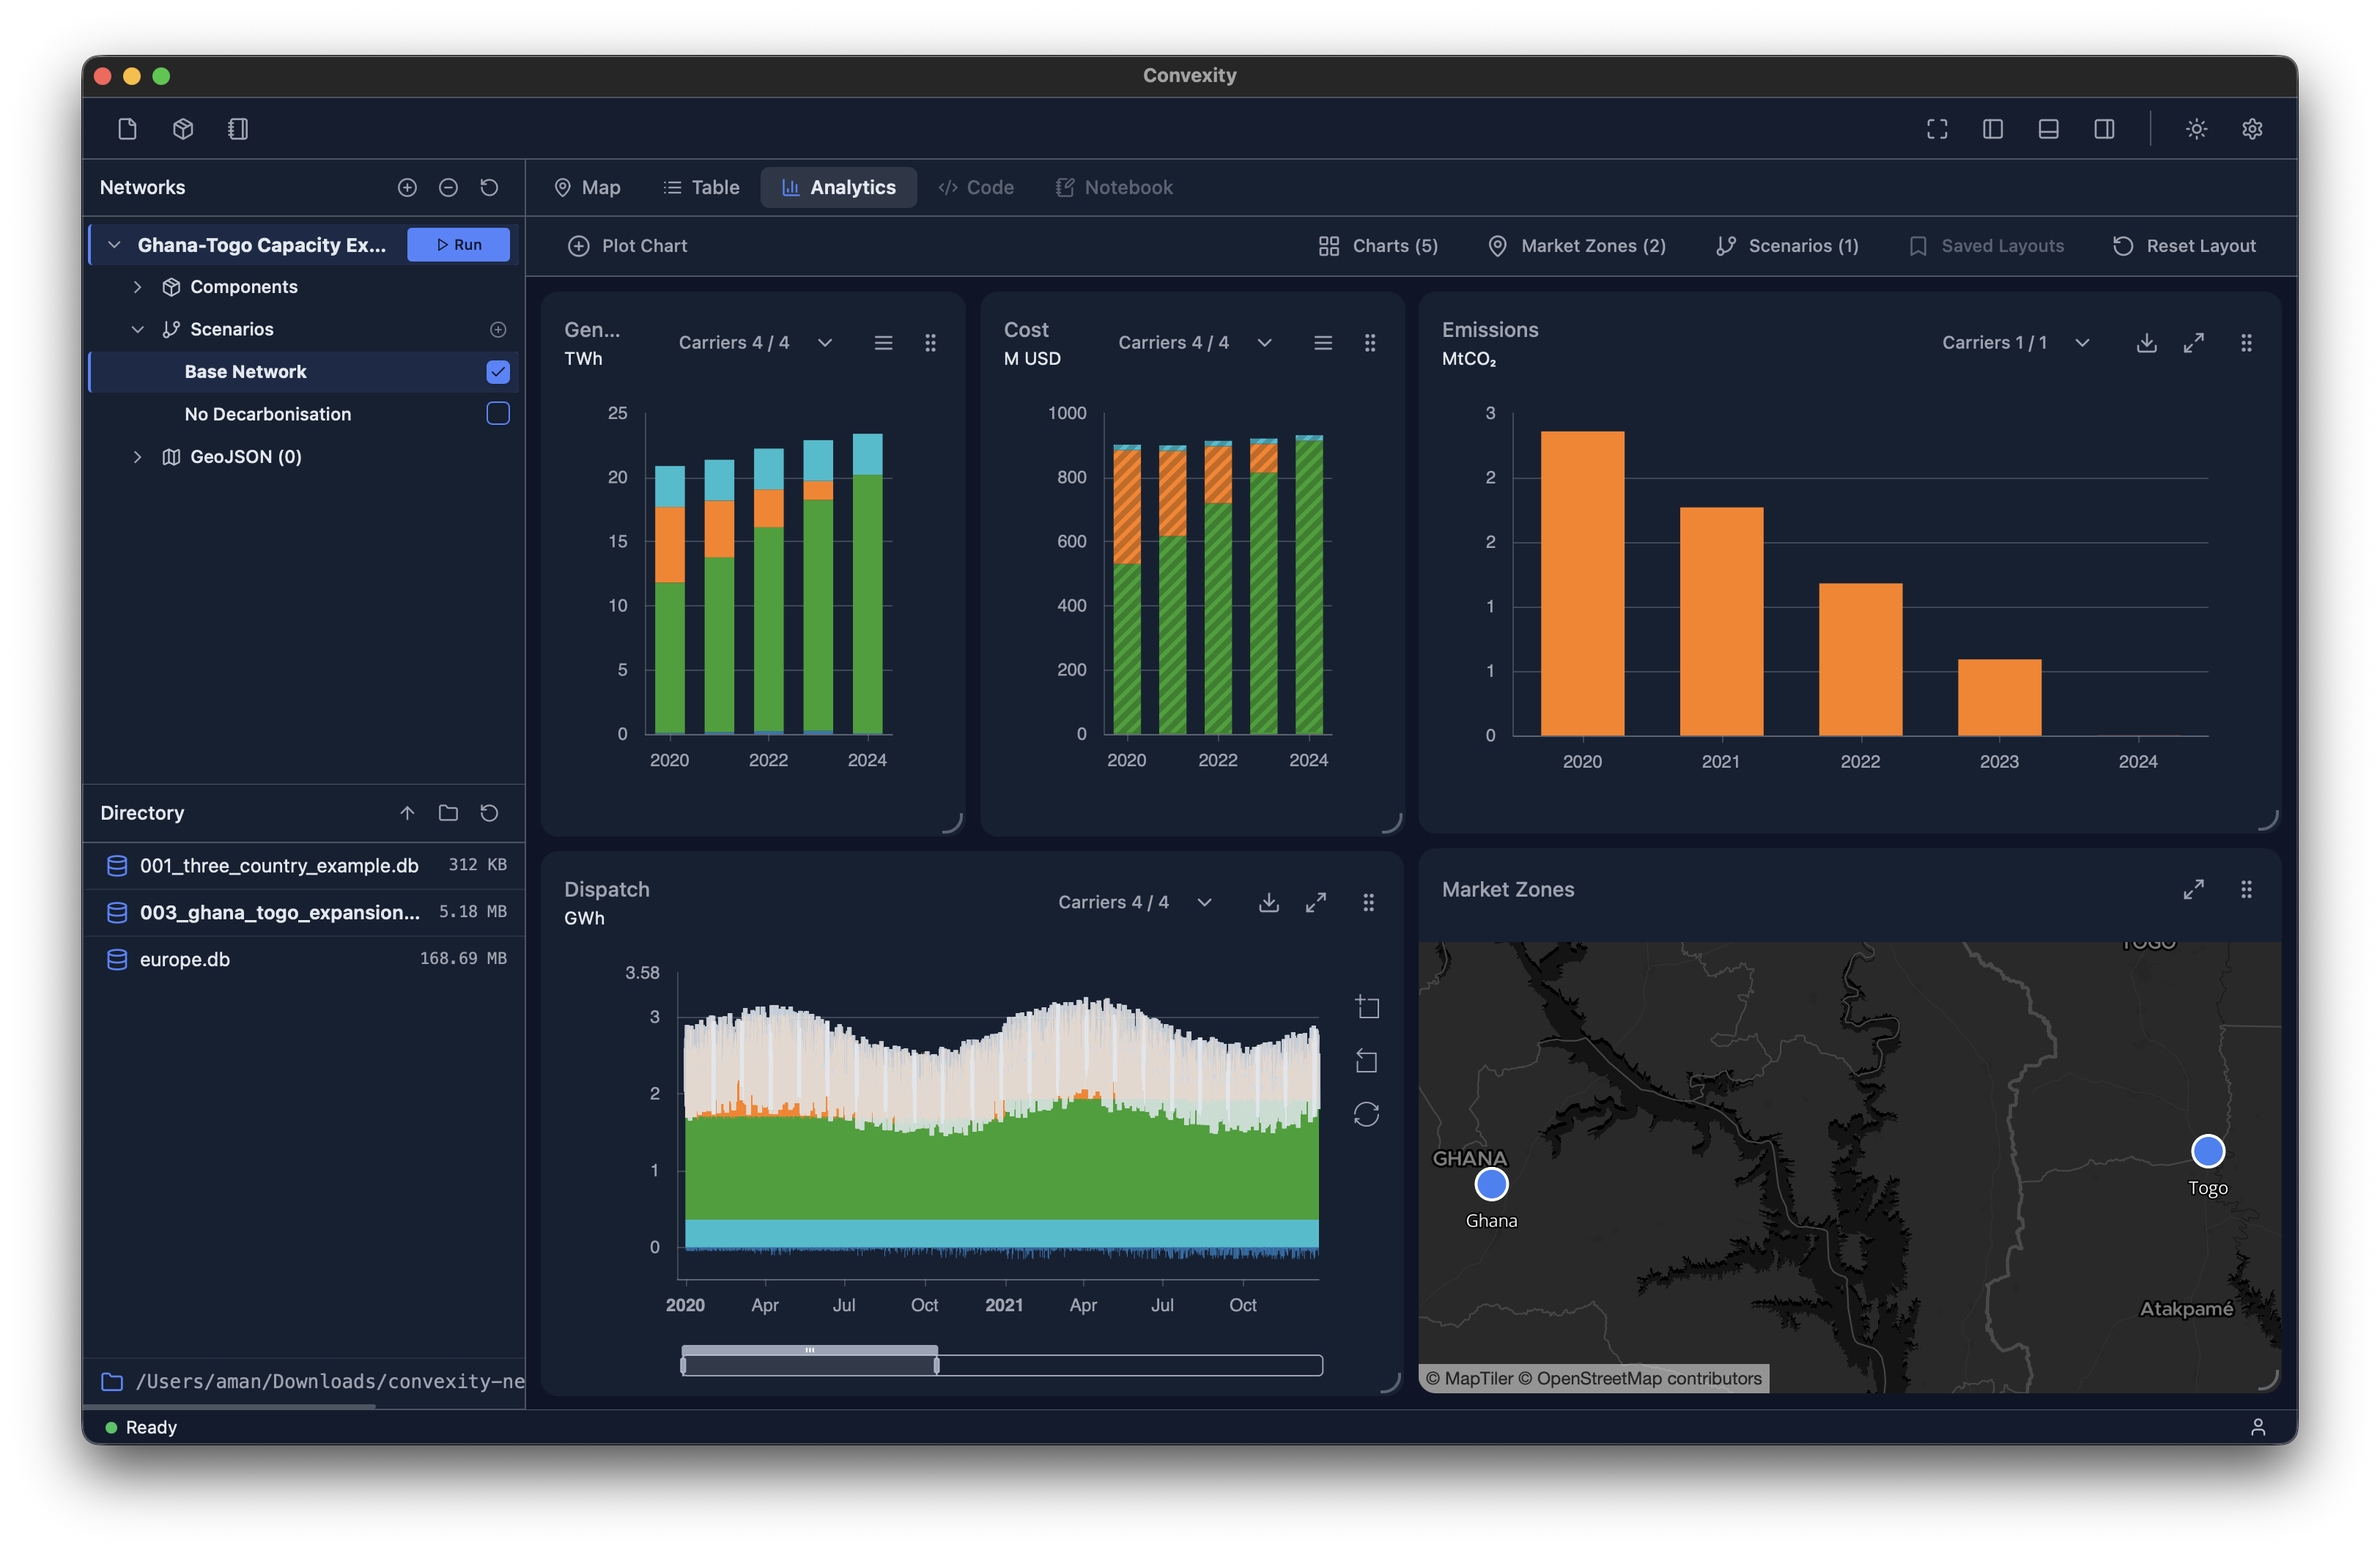
The Analytics view is accessible via the central panel and provides a flexible and configurable dashboard to visualize the outputs from your models.
There are several charts available out of the box in Convexity including: a dispatch stack, cost curves, emissions curves, and more. Charts are displayed as individual cards, where each chart card can be:
- Resized
- Moved
- Hidden
- Viewed in fullscreen
This allows you to configure your dashboard however you want, thereby increasing your productivity. Charts are also interactive—hovering over data points will reveal tooltips containing detailed information about the data at that point. You can also use the chart controls to zoom into different areas of the plots.
Note
The default charts that are displayed within Convexity differ depending on whether you have an Economic Dispatch, Power Flow, or Capacity Expansion Planning model.
Controls
The controls toolbar is located in the top-right of the Analytics view and provides the following options: Charts, Market Zones, Scenarios, Saved Layouts, and Reset Layout.
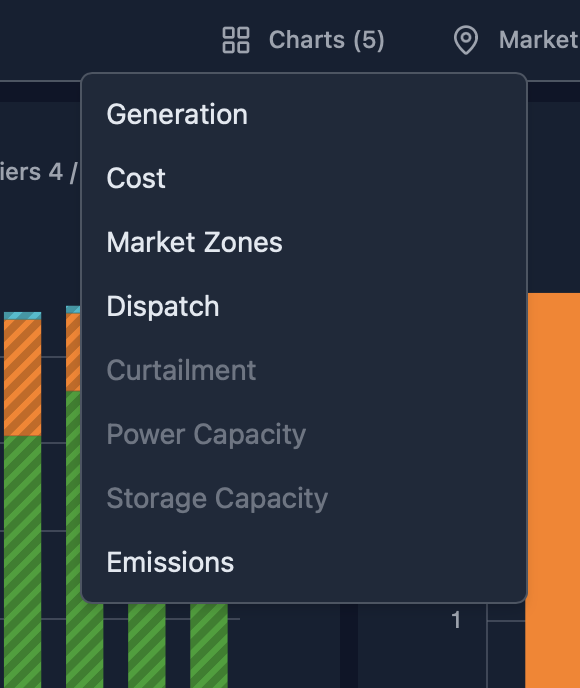
Charts selection
The Charts selection option allows you to toggle individual chart cards on or off in the dashboard. When you turn a chart card on or off, it will automatically appear and be positioned in the available space. You can resize or move chart cards as needed after they appear.
Note
If your Curtailment plot does not show any data when you expected it to, you likely need to set the carrier of interest to be curtailable = TRUE in the Carriers table. Please see the Carriers documentation for more details.
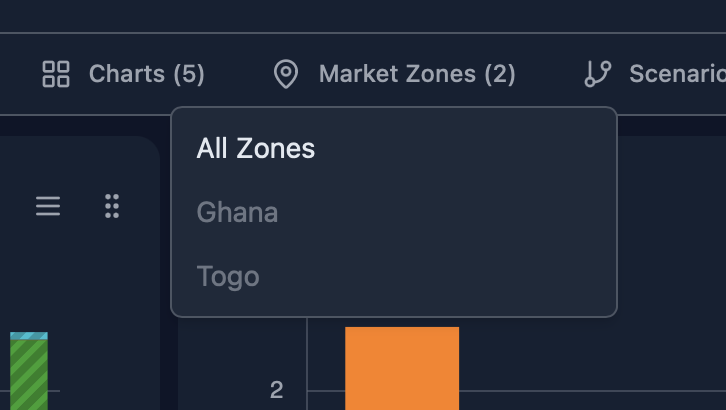
Market Zones filter
The Market Zones selection allows you to focus on one specific Bus (region) at a time or view the whole model at once. This is particularly useful when you have multi-node models and want to quickly analyze the results for a specific region.
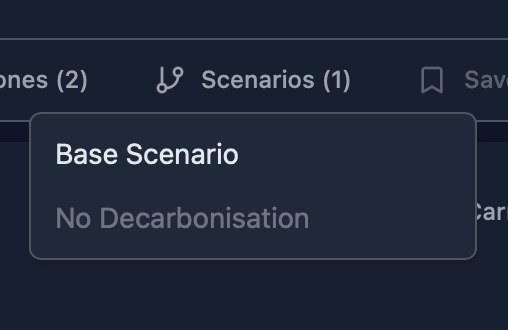
Scenario filter
The Scenario filter allows you to quickly switch between different scenarios to view their results. When you select a different scenario, all charts will update automatically to display data for that scenario. By default, the Base Network scenario results are shown.
Reset Layout
The Reset Layout option restores the default state of the dashboard, returning all chart cards to their original positions and visibility settings.
Custom plots
All energy models require custom visualizations tailored to specific analysis needs. To support this, Convexity's Analytics view includes the ability to create custom visualizations. To create a custom plot, click the "Plot Chart" button in the top left of the Analytics toolbar, which will open the Custom Plot window:
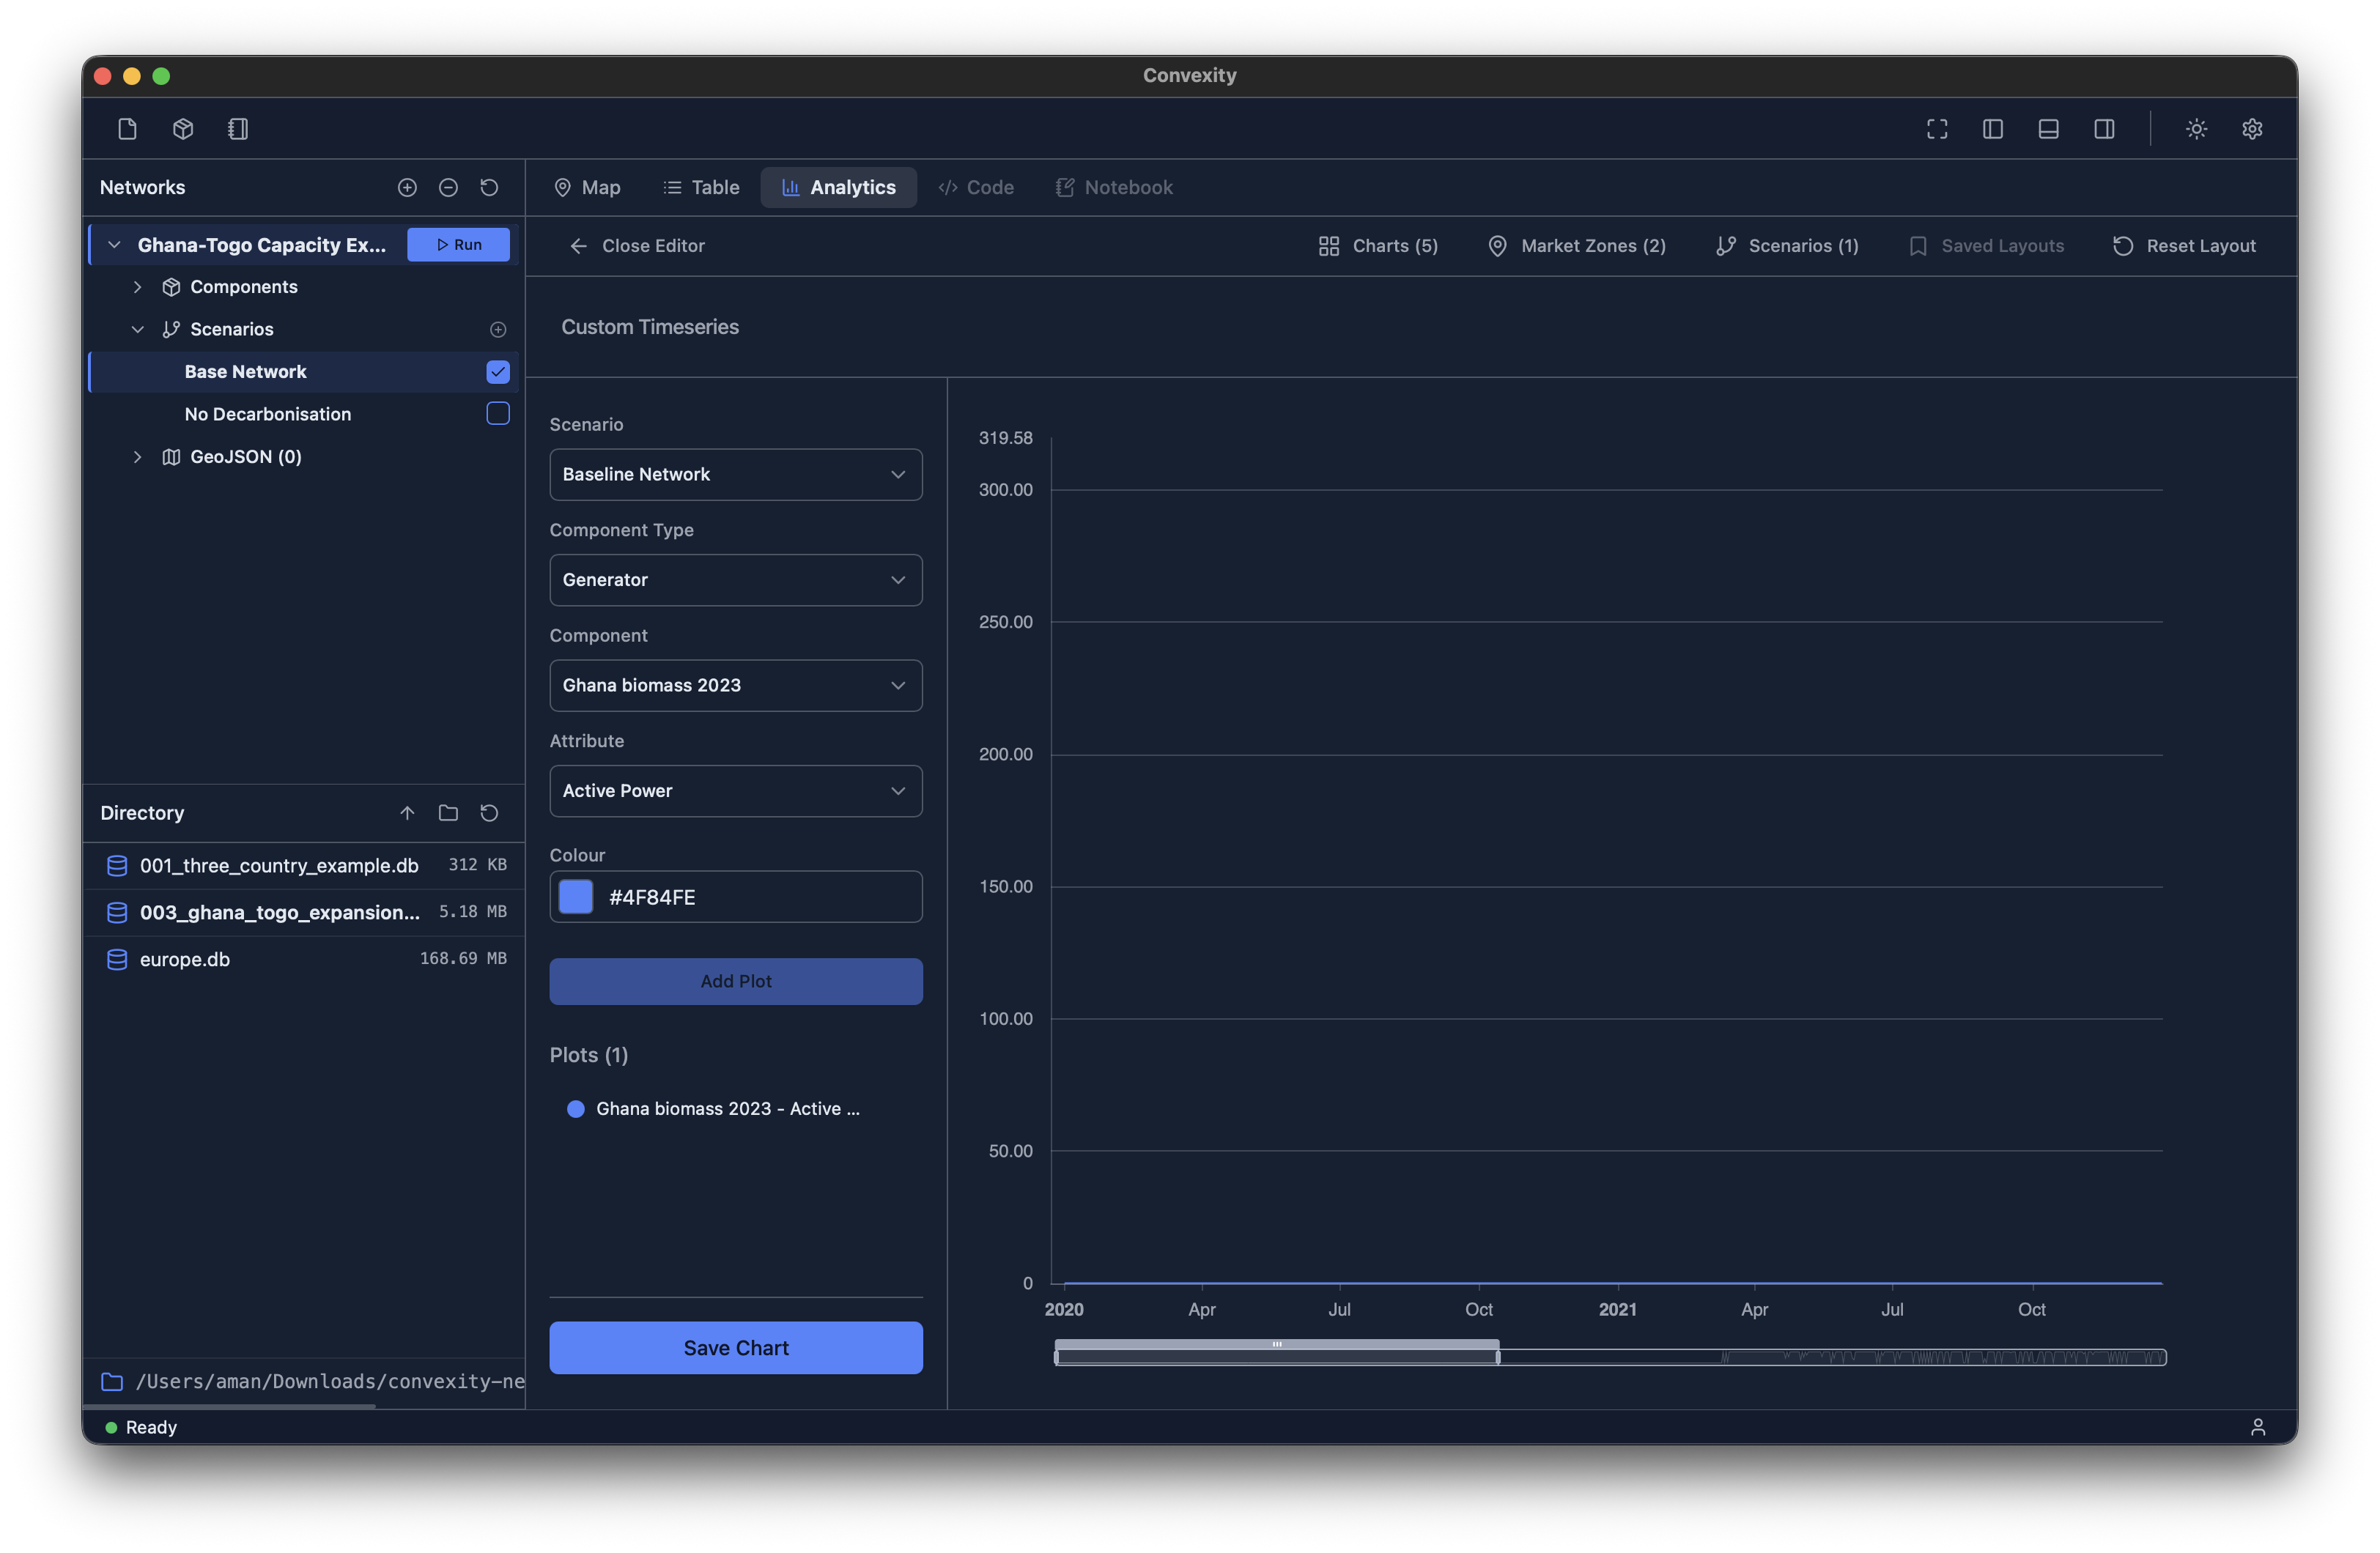
In the Custom Plot window, you can add as many time series to a plot as needed. Once configured, give your plot a name and it will appear in the Analytics dashboard alongside the default charts. Unlike the main dashboard, Custom Plot allows you to visualize multiple scenarios and market zones simultaneously in a single chart, making it easier to compare different scenarios or regions side by side.