Three Country Market
Last updated for Convexity v0.4.2
This tutorial shows a simple three country market model in Convexity.
You can open a selection of example Convexity models by clicking on the cube icon in the top-left of the app:
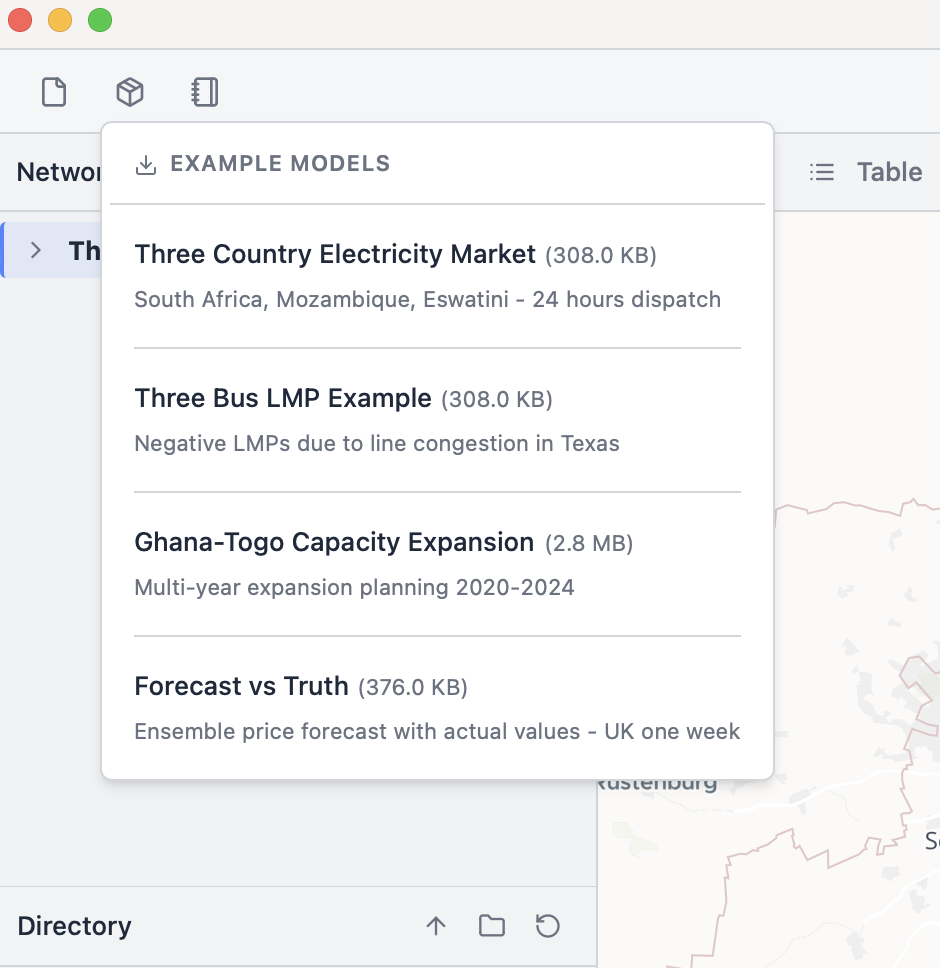
In this tutorial, we will view, edit, and solve the "Three Country Electricity Market" model, based off the example models in the PyPSA documentation. Clicking that model in the menu will download the model .db file to your local directory, and will open it in your application:
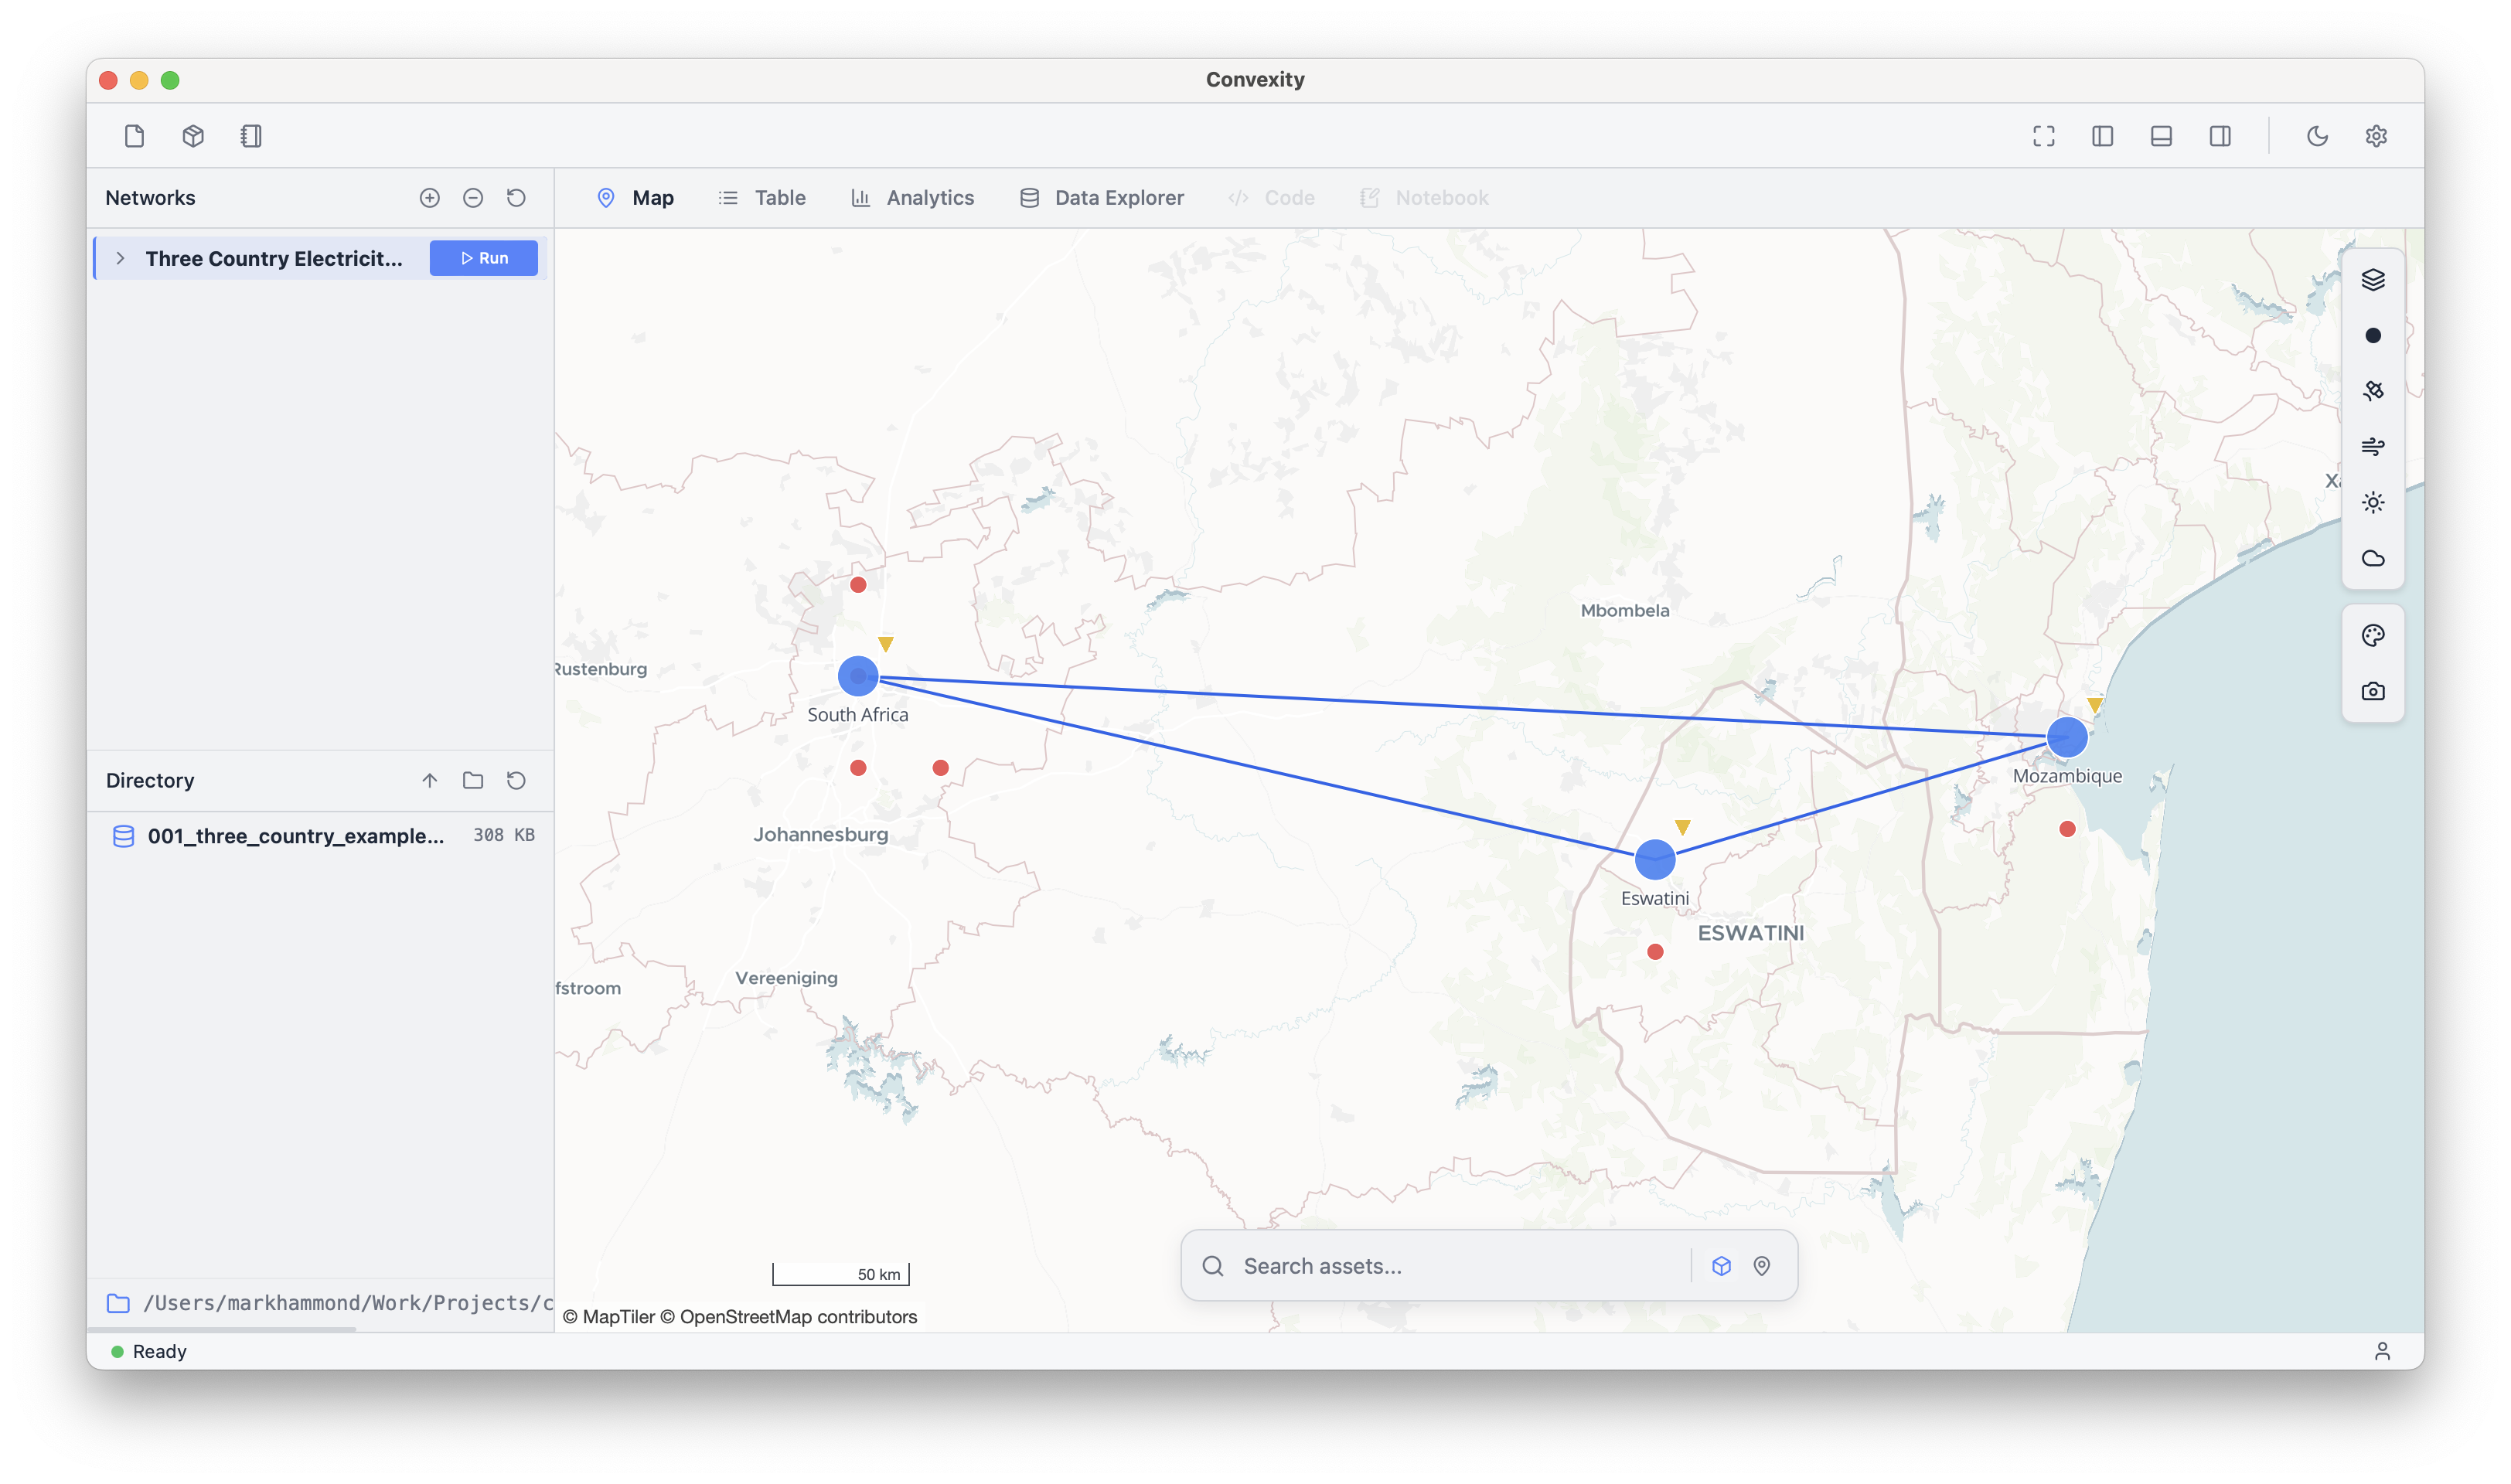
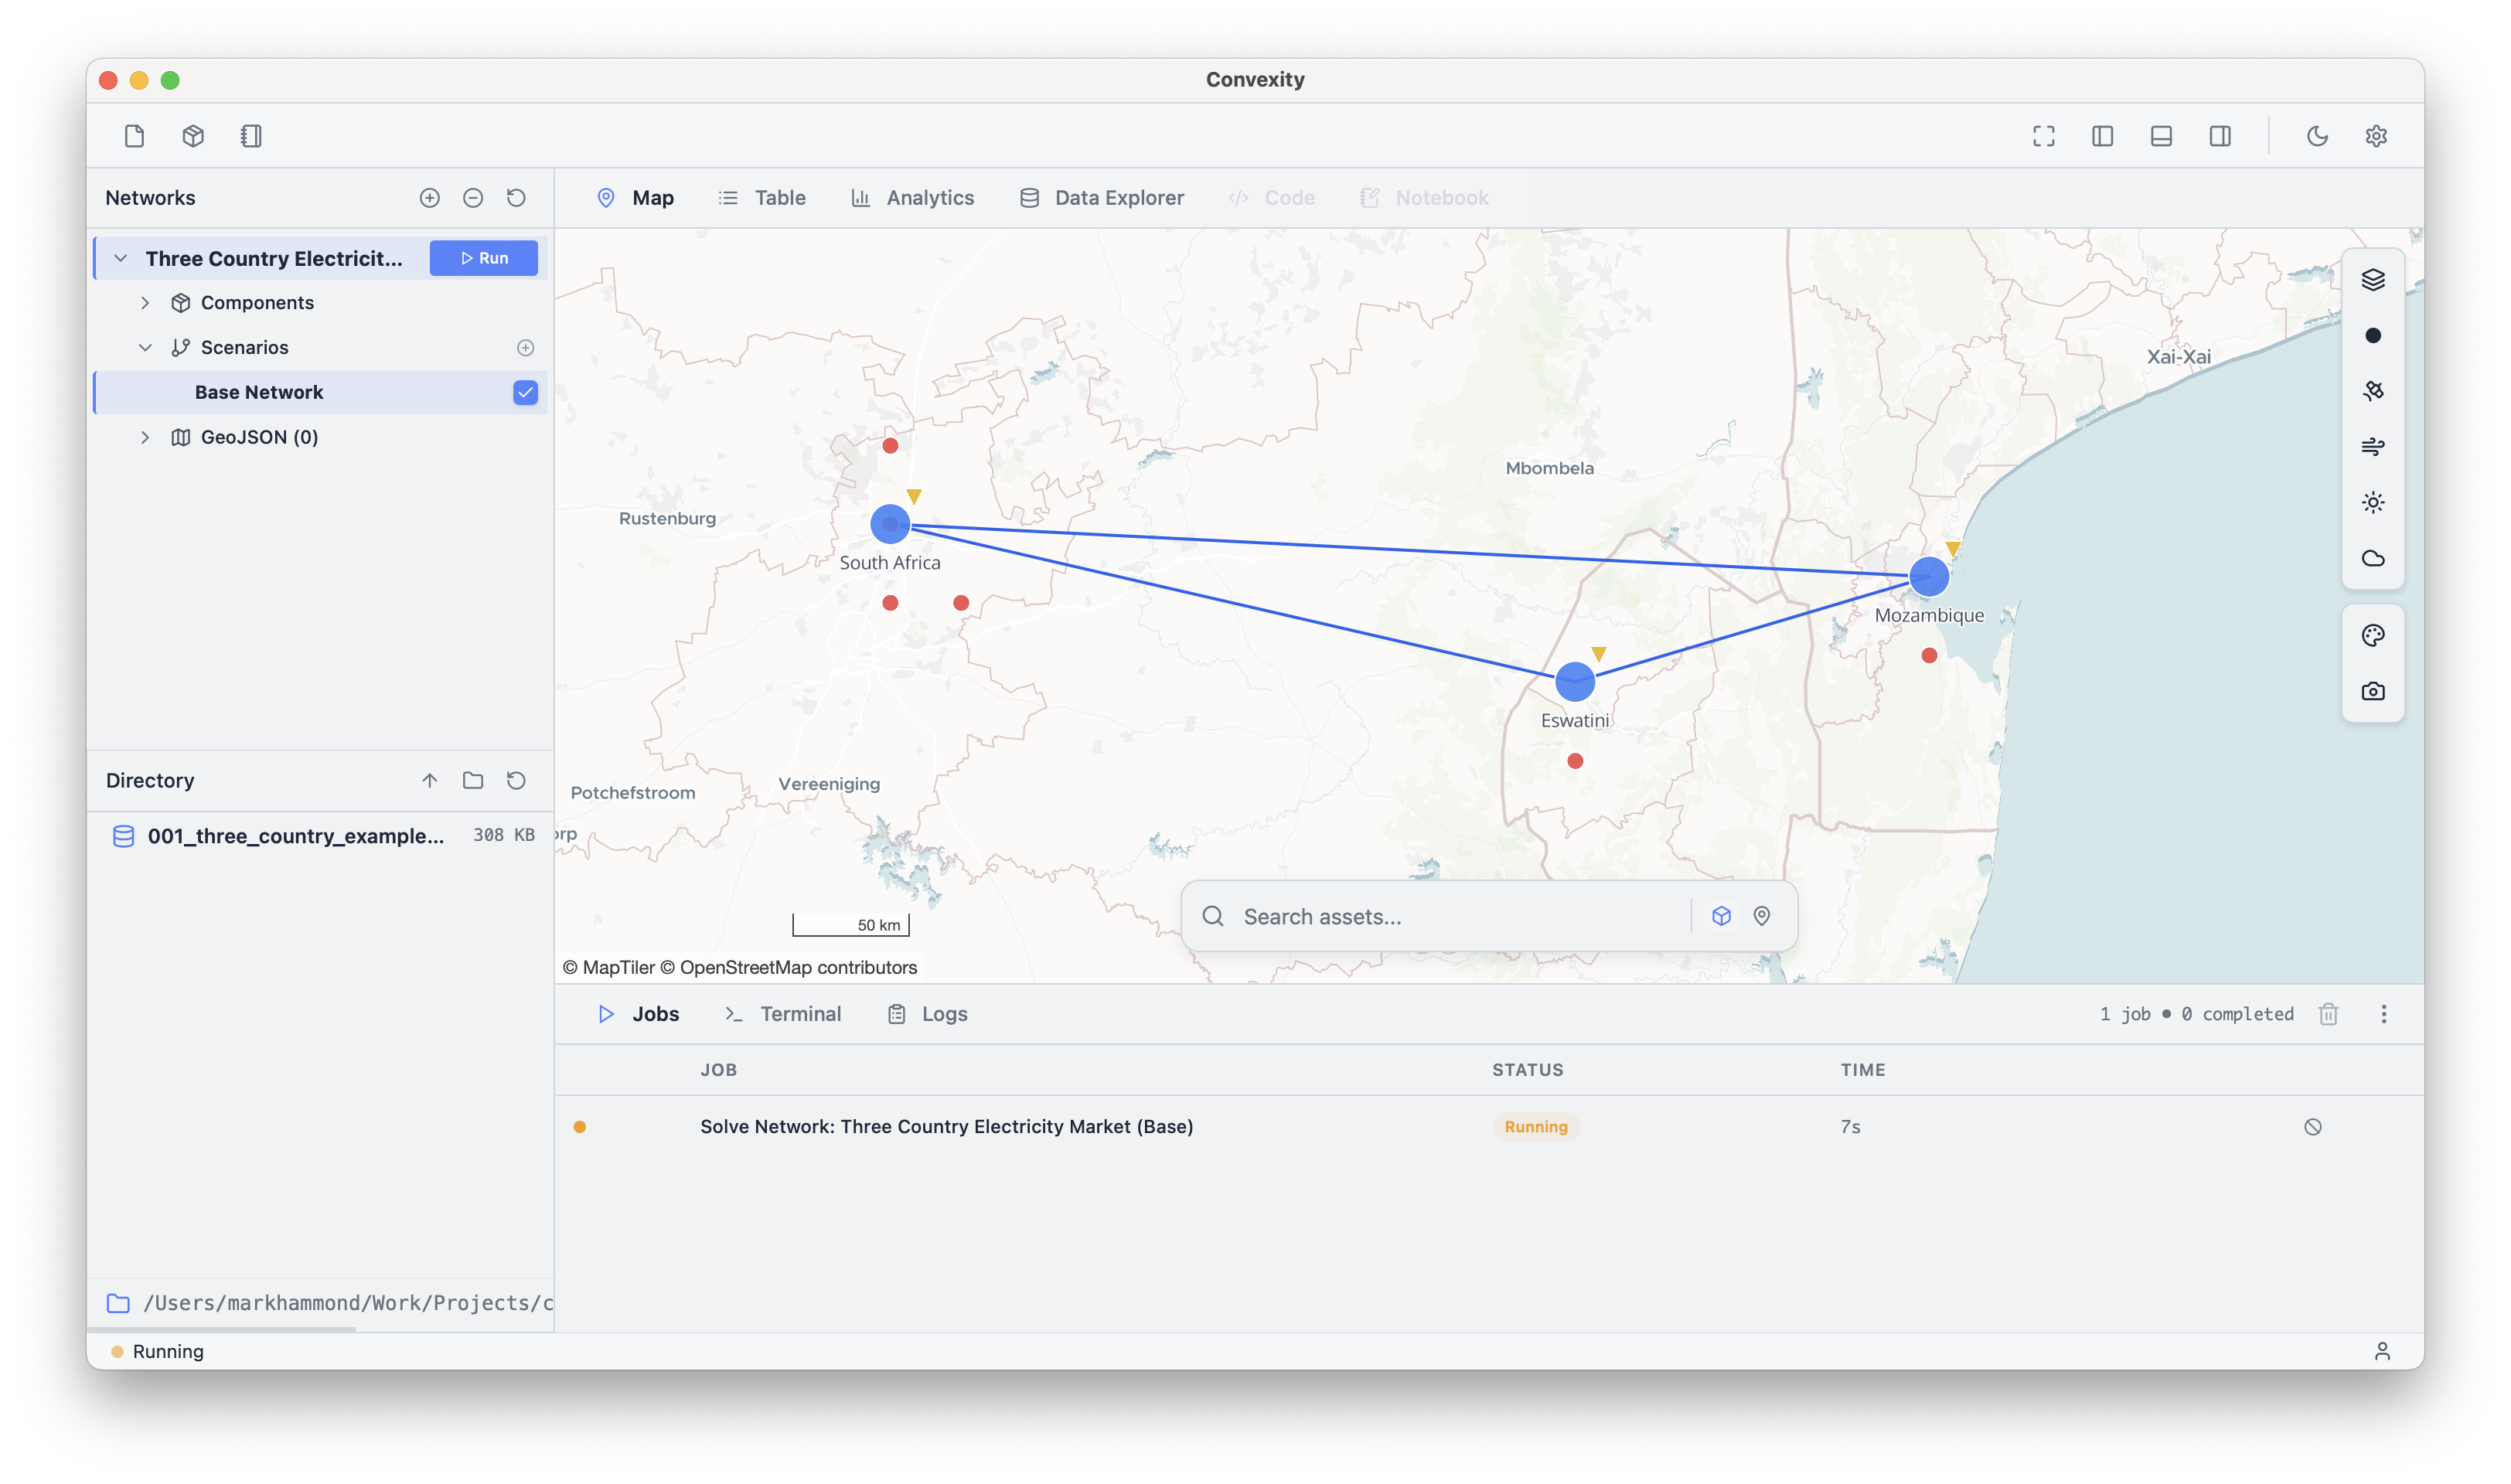
The map shows the components that make up this network:
- Buses, which are the nodes of the network
- Lines and Links, which connect these nodes
- Generators, Loads, etc, which determine the energy balance at each node
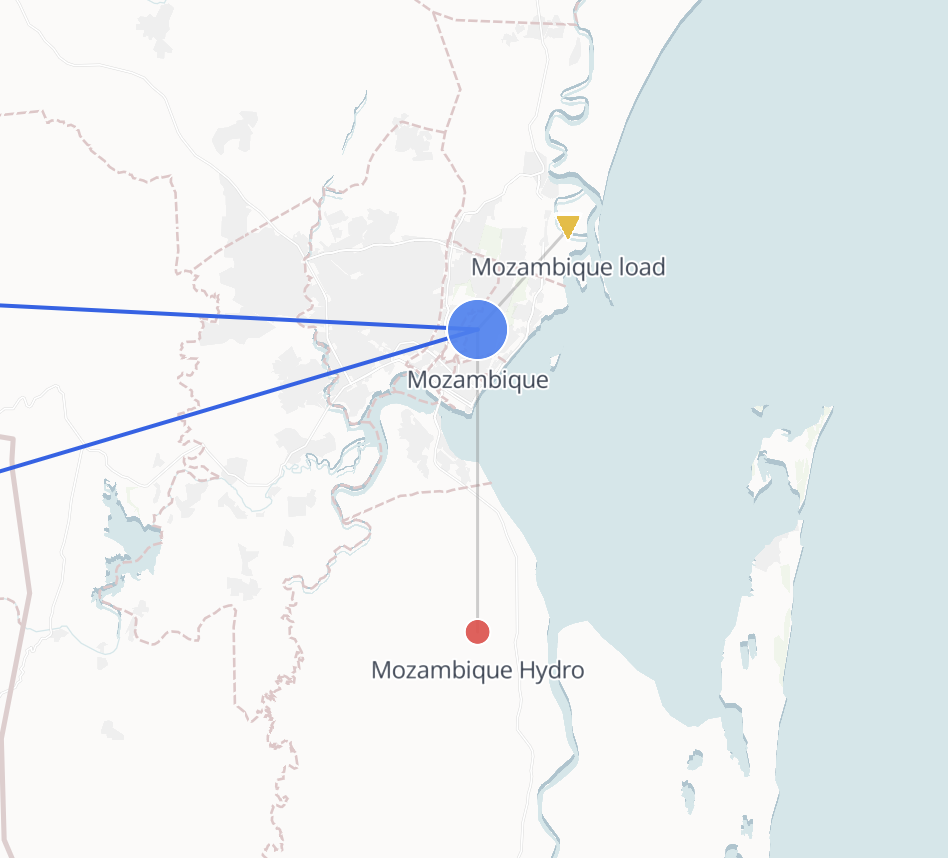
You can see which assets are connected to each bus by hovering over it:
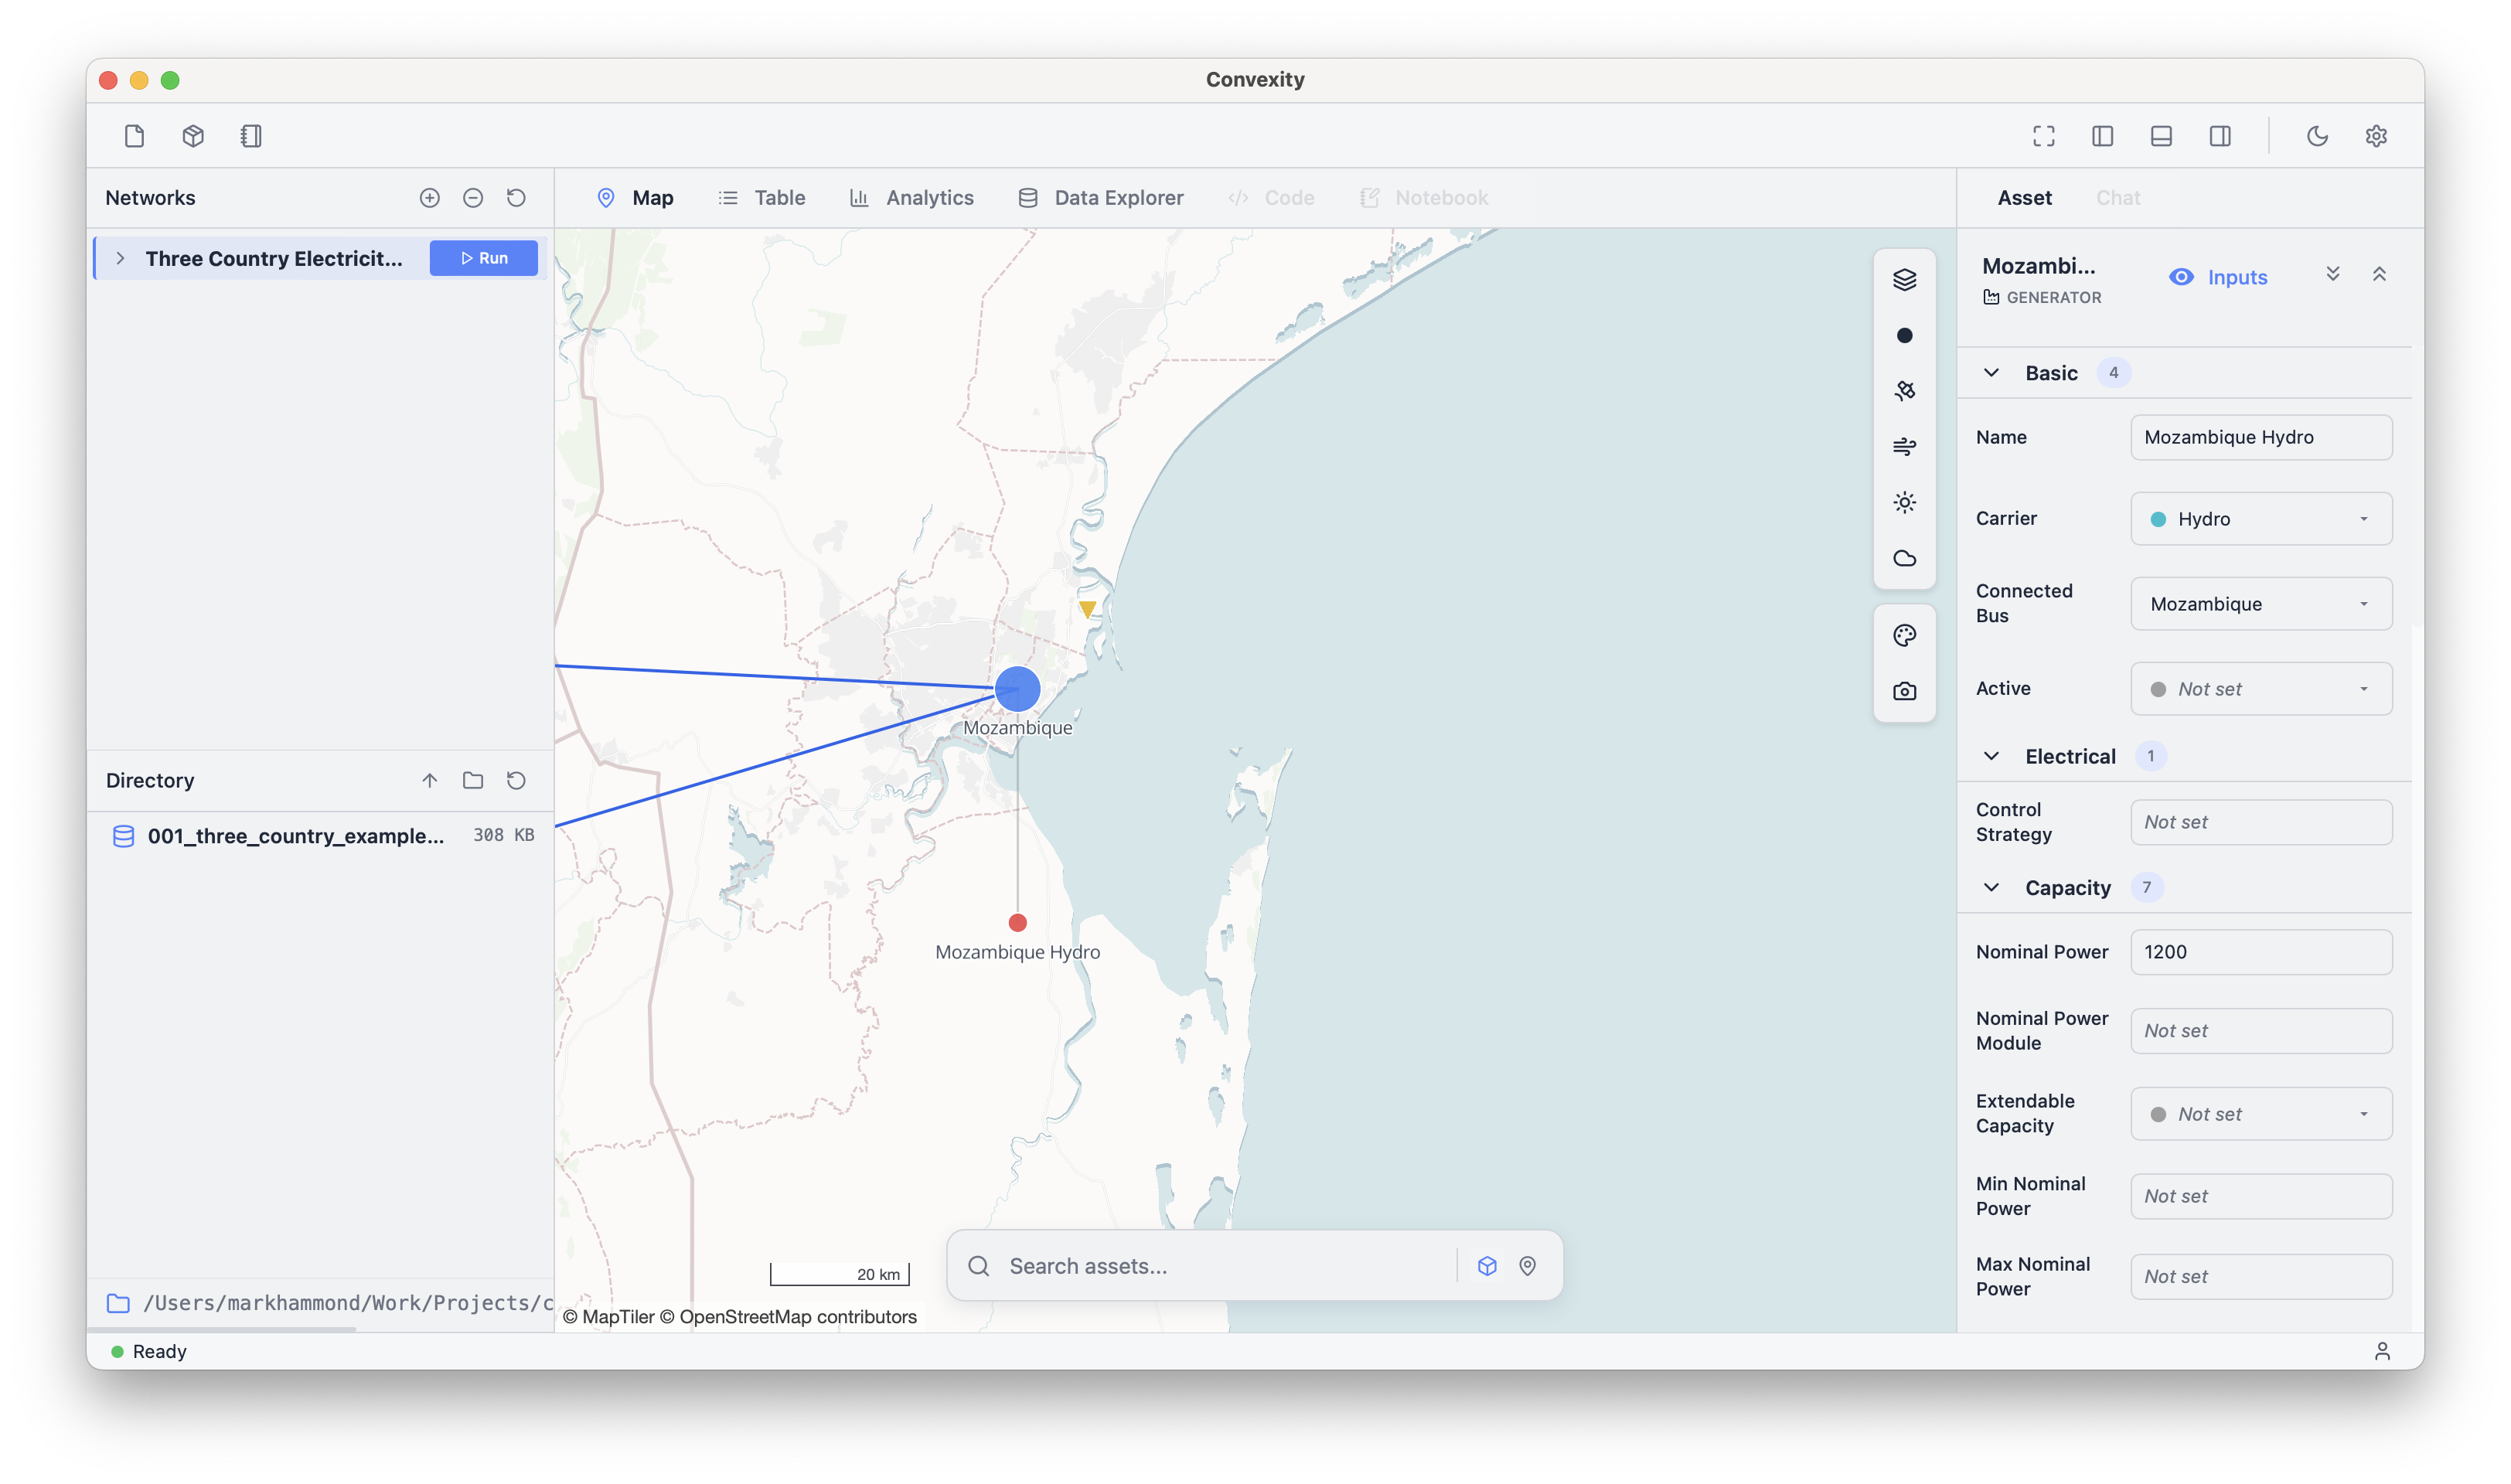
You can click on any component on the map to open a sidebar displaying all of its attributes:
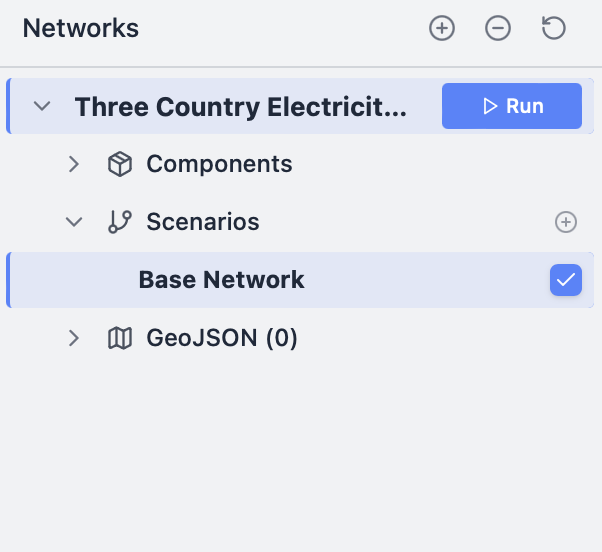
We will show how to edit these attributes in the next tutorial. For now, let's solve the model as it is. Expanding the model name in the tree in the top left shows that it only has one scenario, the "Base Network", which is selected. Click "Run" to solve the model:
This will start the solve process. The solve indicator in the bottom left of the screen will change from "Ready" to "Running". You can click this indicator in the bottom left, or the bottom panel toggle in the top right, to open the job queue:
This model should take about a minute to solve, and will show as "Completed" in the queue when done. You can then select the Analytics tab instead of the Map tab, to view a collection of default charts:
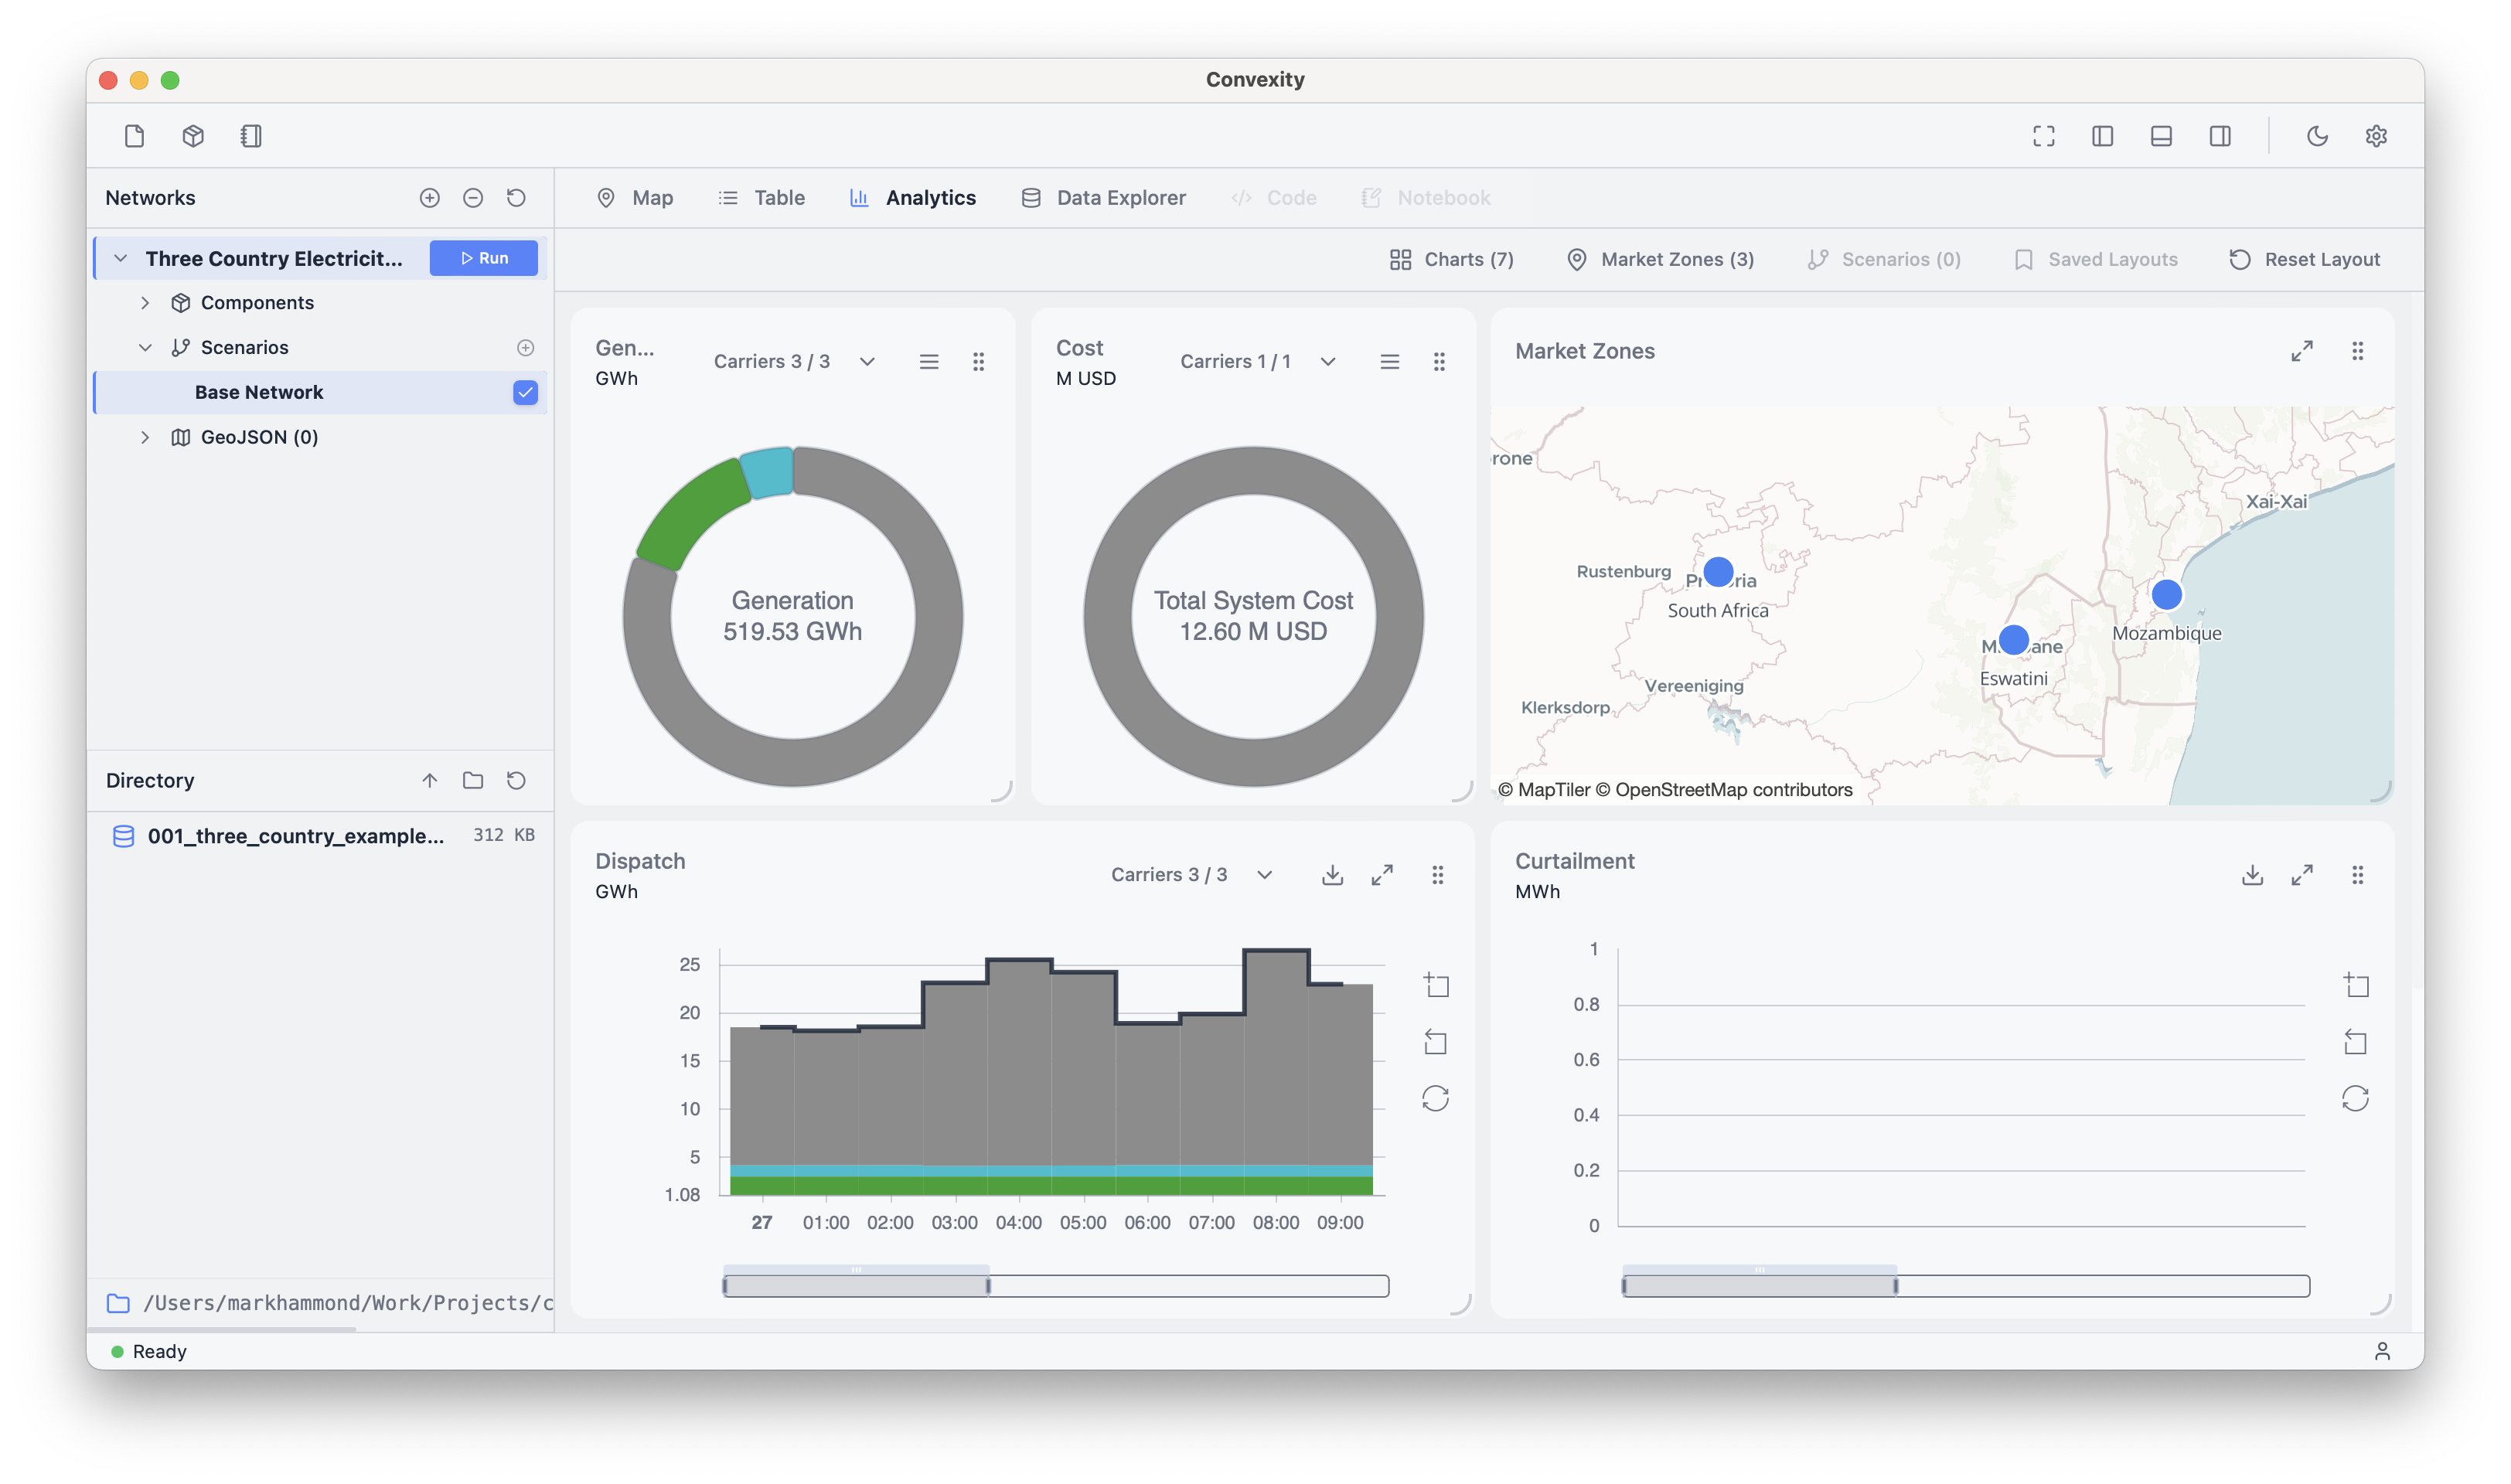
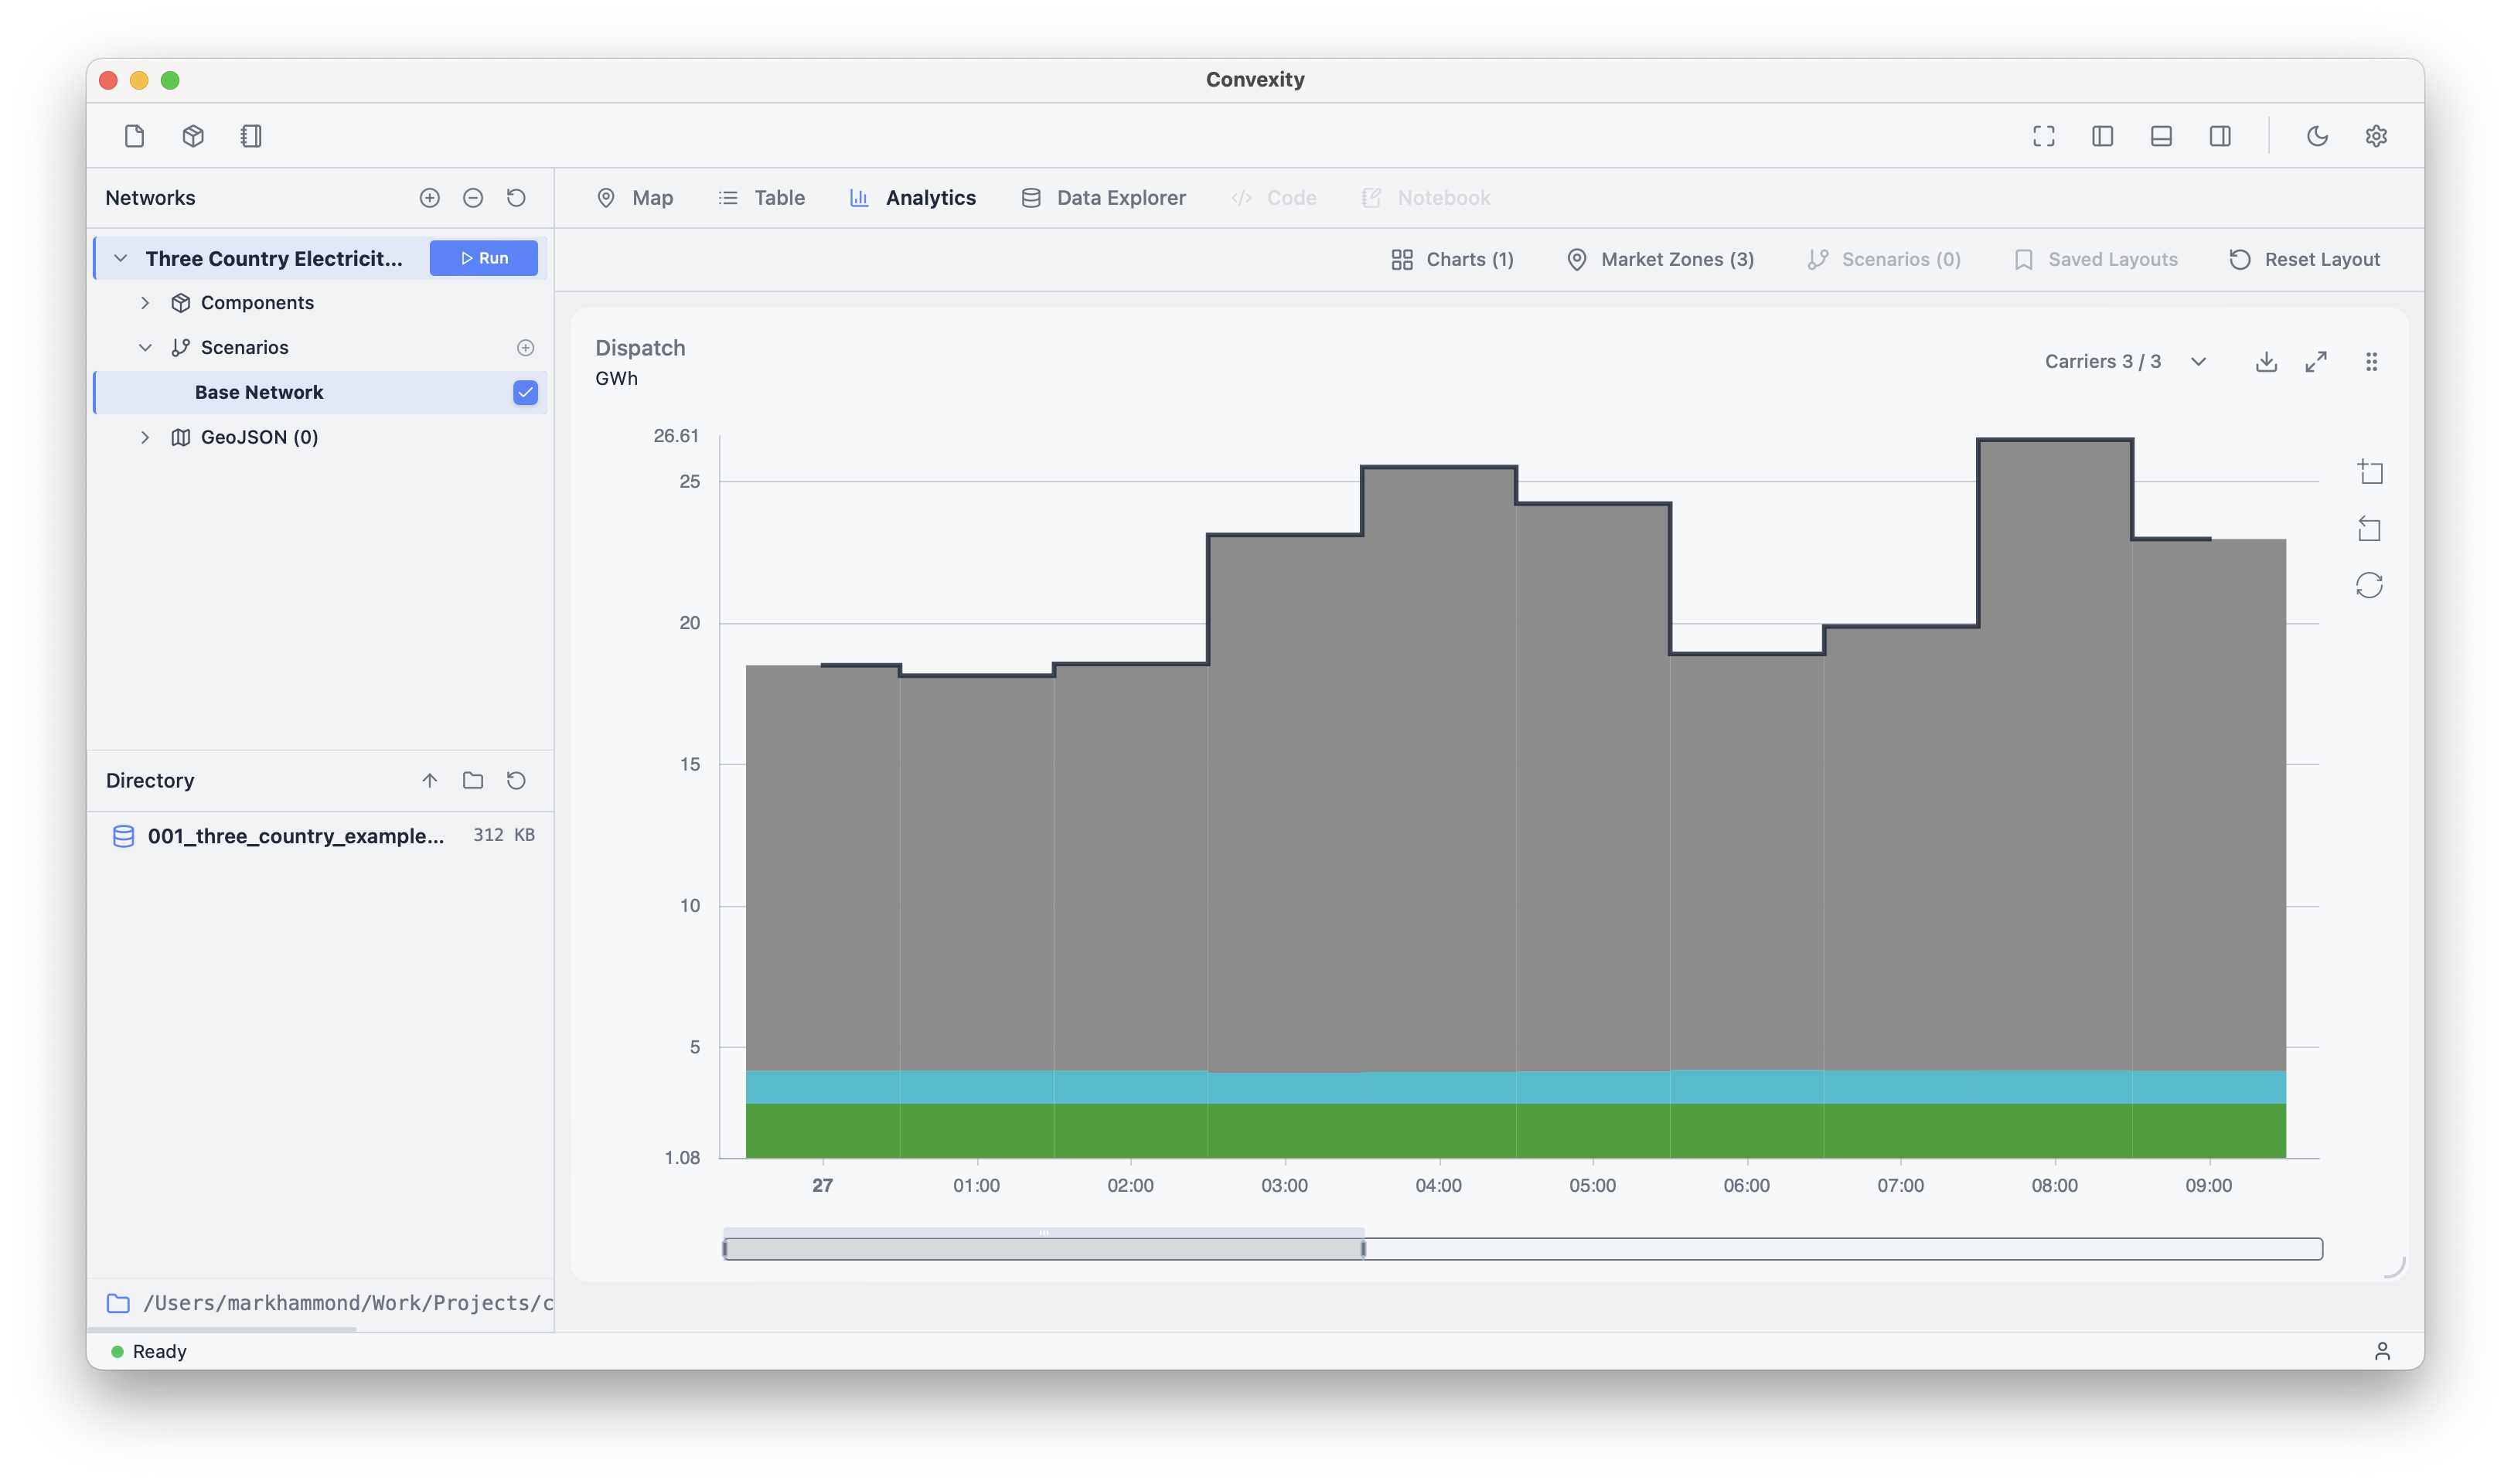
You can close or open specific charts with the "Charts" menu, and you can drag to resize certain charts to make them larger:
In the next tutorial, we will show how to edit attributes in a model network.